

Table of contents
When you’re choosing technology like a point of sale (POS) system for your business, it’s easy to focus on the upfront price. But the price tag rarely tells the full story of what that tool will (or won’t) deliver for your business.
A Capterra survey found that 58% of U.S. businesses regret at least one software purchase made in the past 12 to 18 months. The most common reasons cited were higher-than-expected costs and challenges with onboarding and training new users. And these regretted purchases had real consequences: businesses reported becoming less competitive or productive and losing valuable staff hours because the tools were difficult or unpleasant to use.
That’s why understanding the total cost of ownership (TCO) is so important. TCO gives you a complete view of what a system will cost over its entire life — not just the price you pay upfront, but also the cost of setting it up, running it, and eventually replacing it. More importantly, it helps you weigh what you’ll gain (and potentially lose) across the full lifecycle of a tool.
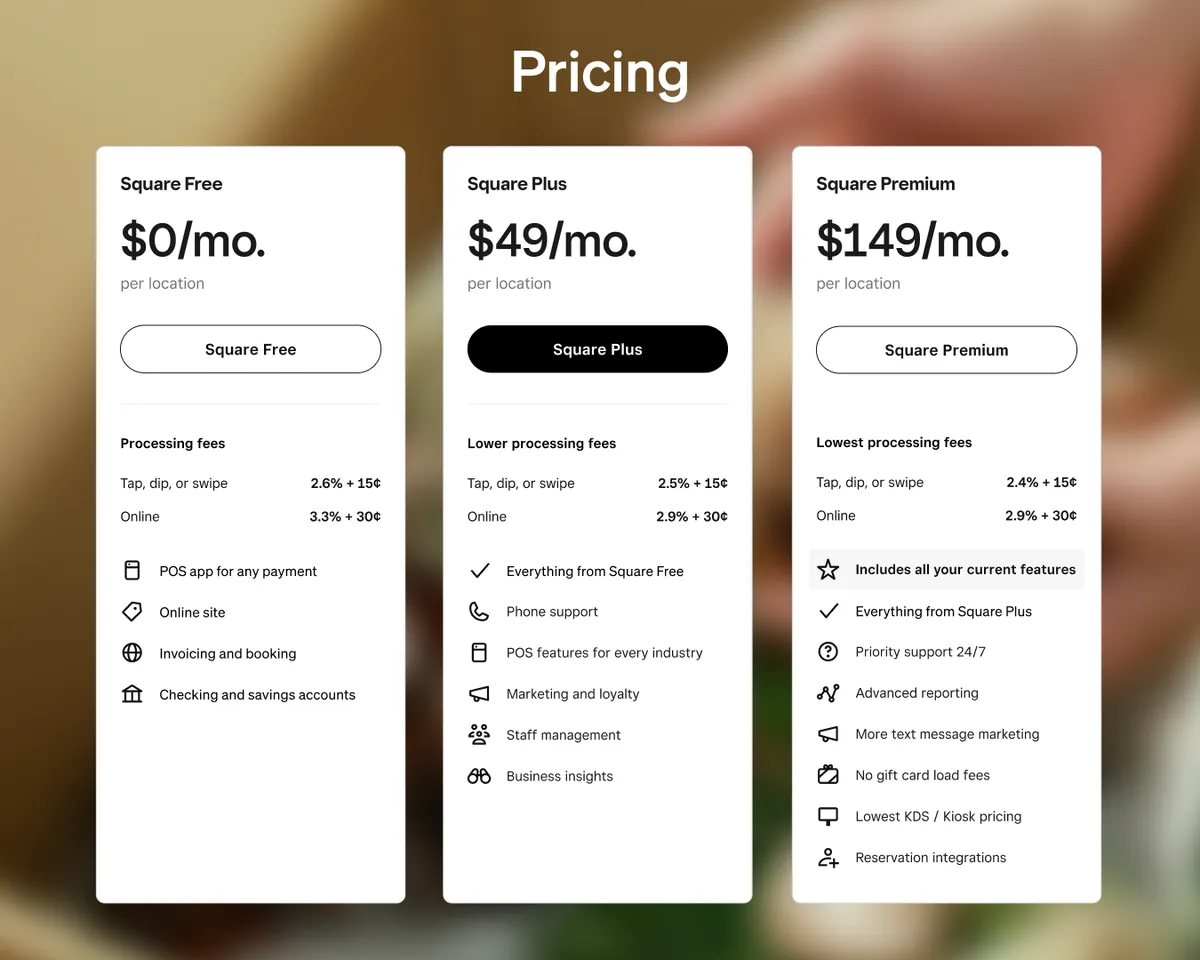
With the new Square transparent pricing plans — Square Free, Square Plus, and Square Premium — understanding TCO has never been simpler. Each plan bundles essential tools like POS, payments, staff management, and marketing into one predictable monthly cost. That means you can focus on running your business rather than managing multiple systems or hidden add-ons.
When you evaluate technology this way, you’re comparing value for money rather than just comparing prices. A proper TCO analysis helps you avoid unpleasant surprises, compare vendors fairly, and choose technology that supports your growth instead of draining your profits.
In this guide, we’ll walk through how to run a TCO analysis step by step, what costs to include, and how to tailor your approach to your industry — whether you run a restaurant, retail business, beauty salon, photography studio, or lawn care business. You’ll also see why the Square transparent pricing model and unified ecosystem make this process easier, helping you make confident, long-term decisions that support your business growth.

What is Total Cost of Ownership (TCO)?
Total cost of ownership (TCO) is a way to measure and understand the complete financial impact of a technology solution over its entire lifecycle. It looks beyond the initial purchase price to include every cost — and every source of value — that comes from owning and using the tool.
For example, a POS system might appear affordable upfront, but if it requires multiple add-ons or separate software for payroll, inventory, or marketing, the real cost rises quickly. On the other hand, a system that includes those features from the start can deliver far more value for the same or even lower long-term investment.
The Square approach to product design directly supports this concept. Each plan includes the foundational tools most sellers need, such as loyalty programs, customer engagement, and staff management, reducing the need for third-party subscriptions or integrations.
A TCO analysis brings these details into focus. By looking at setup, operating, and replacement costs alongside the productivity and revenue gains a system enables, you get a clear picture of what you’re truly paying for — and what you’re getting in return. It’s as much an exercise in finding value as it is in uncovering cost.
Why TCO analysis matters
Without calculating the total cost of ownership, it’s easy to underestimate how much a system really costs. Integration fees, retraining expenses, and downtime can add up fast. So can software upgrades, hardware replacements, and contract renewals. Many tools may require extra subscriptions or third-party add-ons for essentials like loyalty programs, marketing, or analytics. By the time these costs appear, it’s often too late to plan for them.
A thorough TCO analysis can transform how you evaluate technology for your business and reduce post-purchase regrets. Here’s what you gain from taking this approach:
- Predictable budgeting: You know what to expect and what to budget for across the full lifecycle of a tool.
- Fairer vendor comparisons: You can evaluate each solution on equal footing instead of being swayed by a low entry price.
- Fewer hidden risks: You can spot extra costs and prepare for potential disruptions before they happen.
- Smarter long-term planning: You can align technology choices with your business goals and growth trajectory.
- Better long-term value: You can choose software that grows with you and delivers sustainable value, not just a lower upfront cost. For example, you can access most Square software for one monthly price with no long-term contracts required, while similar providers may charge a low rate at first but require multi-year commitments and raise prices once contracts are up for renewal or charge high fees for essential add-ons.
When done right, a TCO analysis helps you see the full return on your technology investments — not just what they cost, but how they perform over time.
How Square approaches transparent pricing
One of the biggest challenges in calculating the total cost of ownership is that many vendors don’t make it easy to understand what you’ll actually pay. A low purchase price for a point-of-sale might hide different rates for credit card brands, as well as add-on fees for integrations or even basic features you assumed were included. That makes it difficult to compare solutions fairly and leaves business owners guessing.
Square takes a different approach. You get clear, transparent pricing. There are no hidden setup costs and no long-term contracts required. That transparency simplifies both budgeting and TCO analysis, helping you plan for the future with confidence. “The bundling— it makes everything easier. Simplifying is so helpful right now. It’s a breath of fresh air,” said Cydney Langford, Owner of Wink Skincare Studio in McMinville TN.
You can use the Square Payments Fee Calculator to model your transaction costs using your actual sales volume. Plug in your numbers and see exactly what you’ll pay in processing fees and where those fees go. That level of clarity makes it easier to compare Square with other vendors and understand how costs will scale as your business grows.
With the Square pricing plans, you make a single purchase decision that gives you access to nearly the entire Square ecosystem.
- Choose from three plans, each with one predictable monthly fee.
- One card-present rate for all in-person tap, dip, and swipe payments across all card brands and types, and one rate for online and invoice payments.
- Unlimited use of tools like staff management, loyalty, and email marketing without per-device or per-user charges.
- One monthly bill for consistent software costs and simpler forecasting.
This kind of transparent, unified pricing makes TCO easier to calculate and manage. With Square, you know exactly what you’re paying for, what’s included, and how your costs will change as your business grows — before you even get started.
How to calculate TCO: A step-by-step framework
While there’s no single formula that works for every situation, the goal is always the same: to capture the full lifetime cost of a system so you can compare options fairly. Here’s a simple three-step framework you can follow.
Download the Total Cost of Ownership Worksheet to follow our step-by-step tactical approach.
Total Cost of Ownership Worksheet
Thank you!
Check your email for your resource.
Step 1: Define the scope of the solution
Start by clearly defining what solution you’re evaluating and which features are non-negotiable. Without a clear scope, you risk comparing tools that don’t solve the same problem, which can make your analysis unreliable. Reflecting on what your needs are now and what they could look like in the future will ensure that you choose a provider that can grow with you, not one you outgrow.
For example, a quick-service restaurant with 10 locations might be evaluating POS systems. The essential scope could include payment processing, loyalty and rewards, and inventory management, with multi-location functionality and scalability as new stores open. A salon with three locations might analyze staff scheduling and payroll software. Critical requirements could include time tracking, commission calculations, payroll integration, and mobile access so staff can easily manage their schedules.
Setting these requirements early ensures you’re comparing vendors on equal footing — based on whether they meet your current and expected needs in the future, not just on price.
Step 2: Gather your business numbers and define assumptions
Next, bring in your own data. The scope you defined in Step 1 determines which metrics matter most. For example, transaction volume will be more important when comparing POS systems, while inventory size and turnover rate may matter more for inventory management tools. The more accurately you can model your operations, the more realistic your TCO analysis will be.
Here are some of the key numbers to consider:
- Average order size (to model transaction fees)
- Monthly or annual sales volume (to apply vendor fee structures)
- Number and mix of transactions (online vs. in-person vs. ACH)
- Debit vs. credit transactions mix
- Credit card brand mix (e.g., Visa, Mastercard, American Express)
- Number of staff who will use the system
- Average wage or hourly rate (to estimate training or retraining costs)
- Number of locations or terminals (to model hardware and license costs)
- Growth projections (new locations, expected annual sales increases)
- Types of hardware and accessories (receipt printers, cash drawers, networking equipment)
Document your assumptions clearly so your model stays transparent and credible. For instance, you might note that your average ticket size is $20, based on 2024 POS reports, or that employee turnover averages 20% per year, according to your HR data. Keeping these notes alongside your calculations makes it easier to revisit or update your analysis later.
Step 3: Quantify and compare costs per vendor
Finally, use your defined scope and gathered data to map out what each solution will cost and deliver. The goal is to identify the system that delivers the strongest return on your investment over time.
For each vendor, categorize costs into four main groups:
- Setup and implementation costs (hardware, training, integrations)
- Operating costs (subscriptions, processing fees)
- Growth and scaling costs (extra locations, users, or features)
- Replacement or exit costs (termination fees, migration expenses, retraining)
See the full list of items to consider under each category in the section below.
You should also consider qualitative factors like efficiency or time saved and staff adoption to reveal each option’s full value.
Add up each category for a total one-year and multi-year view. Then compare vendors side by side using the same assumptions and structure.
Example:
Suppose you’re comparing Vendor A and Vendor B for a POS solution. Vendor A’s listed price is higher than Vendor B’s, but that price includes built-in loyalty and marketing tools for unlimited use at no extra charge. Vendor B, on the other hand, requires a separate loyalty program priced in tiers based on the number of customers enrolled and also depends on third-party software for marketing. The third-party software charges based on the number of messages sent and requires a custom integration.
Here’s how the comparison might look over one year:
|
Cost category |
Vendor A |
Vendor B |
|
Base software subscription |
$250/month |
$150/month |
|
Loyalty program software |
Included (unlimited use) |
$100/month (tiered by customer size) |
|
Marketing software |
Included (unlimited messages) |
$0.03 per message + integration setup ($500 one-time) |
|
Integration & maintenance fees |
None |
$100/month for custom integration support |
|
Total estimated annual cost |
≈ $3,000 |
≈ $5,000–$6,000 (depending on usage) |
Although Vendor A’s base price appears higher, Vendor B’s add-on and integration costs quickly add up. When you account for all expenses plus the time saved managing fewer systems, Vendor A delivers stronger long-term value despite the higher base price.
Looking at the results this way helps you see beyond year one and understand which solution truly supports your business growth over time.
Full list of costs to consider when calculating TCO
As you start quantifying and comparing vendor costs, use the list below to make sure you’ve captured every possible expense.
1. Setup and implementation costs
These are the one-time expenses that come at the very beginning of ownership. They’re often easy to underestimate but can significantly affect your total investment.
- Installation and setup fees: Initial system configuration or data uploads.
- Training for staff: Onboarding and time spent learning the system.
- Required add-ons or modules: Loyalty programs, reporting dashboards, or appointment scheduling tools.
- Custom integrations: Connecting your POS to accounting, payroll, or delivery systems.
- Data migration: Moving customer, product, or inventory data from an old system into the new one.
- Hardware: Registers, printers, scanners, tablets, leasing vs. purchasing hardware outright, or any other required devices.
Some vendors lease hardware or roll the cost into monthly software fees, which can make it harder to track what you’re actually paying for over time. Square, by contrast, offers clear hardware pricing and financing options, making it easier to see how hardware fits into your overall TCO.
2. Operating costs
These are the recurring costs you’ll see month after month or year after year. They often make up the largest share of total ownership expenses.
- Software subscriptions or license fees: Regular payments to access and use the software, typically billed monthly or annually.
- Support and maintenance contracts: Ongoing vendor support and system updates, which may or may not be included in software fees.
- Payment processing fees: Card-present, card-not-present, or ACH transactions.
- Retraining due to turnover: New employees often need time and guidance to learn the system.
- Compliance and security requirements: PCI audits or cybersecurity measures, if applicable.
- Consumables: Receipt paper, labels, or printer ink — small costs that add up over time.
The Square unified ecosystem reduces many of these recurring costs by consolidating software into a single subscription. Features like staff management, loyalty, and marketing are included, with no extra licenses or per-user fees.

3. Growth and scaling costs
As your business expands, your system will need to scale with you. Some vendors make this affordable, while others can make it costly.
- Additional hardware: New registers, kiosks, or terminals for new locations.
- Per-user or per-location licensing fees: Fee increases as your business expands.
- Upgraded subscription tiers: Unlocking advanced features like analytics or enterprise reporting.
- Additional integrations: Adding new partners, delivery channels, or eCommerce tools.
- Higher transaction volumes: Some vendors change fee structures once you reach certain thresholds.
4. Replacement and exit costs
Every system eventually reaches the end of its life. These are the costs tied to leaving one platform for another.
- Contract termination or early-exit fees: Charged when ending a long-term agreement early.
- Hardware write-offs: If existing equipment can’t be reused with a new provider.
- Temporary overlap costs: Running two systems side by side during a transition.
Migration and retraining costs are often considered setup costs for the new system, not exit costs for the old one. However, if one vendor makes migration or data export particularly difficult, that’s a red flag worth documenting in your evaluation.
By accounting for all four categories, you’ll have a realistic picture of each vendor’s long-term cost. It’s often the hidden, ongoing, or exit-related expenses (not the upfront ones) that make the biggest difference to your bottom line.
Industry-specific TCO considerations
Every industry has its cost patterns. Food and beverage, retail, and beauty businesses experience different pressures when it comes to setup, ongoing operations, scaling, and eventual replacement. Understanding where costs typically build up in your industry can help you make more accurate TCO comparisons and plan for long-term success.
Restaurants: Balancing speed, volume, and complexity
- Setting up a hardware-heavy environment: You’ll likely need registers, kitchen printers, kiosks, or kitchen display systems. These add up quickly, especially if kiosk or KDS software is billed separately. Also, factor in setup fees for integrations with delivery platforms or online ordering systems.
- Managing high-volume operations: Payment processing fees add up quickly in high-volume environments, and vendors may also charge separate subscription fees for kiosks or KDS software. Frequent retraining due to high staff turnover increases labor costs.
- Expanding to new locations or concepts: Expansions can trigger higher support fees or push you into enterprise-level plans. Marketing and loyalty programs can also become more expensive as your business grows.
- Switching to a new restaurant system: Long-term contracts and hardware dependencies can make switching expensive. Consider flexible systems that let you upgrade or switch easily as your needs evolve.
Retail: Unifying in-store and online sales
- Launching a multi-register environment: You may need multiple registers per location or paid data migration services to move large product or inventory catalogs from legacy systems.
- Managing inventory and multi-channel operations: Some inventory or stock-tracking tools may carry additional subscription fees. Paying for separate subscriptions to track stock, analyze data, or manage marketplaces can add up quickly.
- Scaling to multiple locations or channels: Opening new stores often means buying extra licenses and sometimes upgrading to higher-tier plans for analytics and reporting. Integrations with eCommerce or marketplaces can also increase costs as channels multiply.
- Replacing outdated systems: Multi-year contracts can make switching providers difficult. Poor data migration support could result in lost historical sales or inventory data.
- Beauty: Streamlining bookings and client care.
- Migrating client data and appointments: Appointment and scheduling systems may include setup fees or require integrations with third-party booking tools. Migrating client histories, such as appointments, notes, and loyalty balances, can also take time and money.
- Managing daily bookings and communications: Monthly subscriptions for booking, CRM, and loyalty tools often represent the biggest ongoing costs. Payment processing fees, commission tracking, and marketing tools (SMS or email) also add up over time.
- Growing your team or locations: Adding new stylists or expanding to additional locations can mean higher subscription tiers or per-user charges.
- Switching tools without disrupting schedules: Some booking or POS platforms charge cancellation fees or make it difficult to export loyalty or customer data, creating potential continuity issues when switching systems.
By understanding the most common cost drivers in your industry, you can make a more realistic TCO comparison between vendors. It also helps you identify where flexible, all-in-one platforms like Square can reduce complexity and costs over time.
Vendor evaluation framework
A total cost of ownership analysis gives you the numbers, but choosing the right technology partner goes beyond math. Even the most affordable solution can become expensive if the vendor is slow to innovate or difficult to work with.
That’s why it helps to use a structured evaluation framework alongside your TCO calculations. Together, they give you a complete picture of both the financial and qualitative factors that influence long-term success.
Here are key areas to evaluate when comparing technology vendors:
- Pricing transparency: Look for vendors that make all fees easy to find and understand. Hidden add-ons or unclear billing structures often lead to higher TCO over time. The Square pricing page shows exactly what each plan includes and what you’ll pay for software, payment processing, hardware, and optional add-ons, so you can calculate exactly what you’ll pay before you commit.
- Industry fit: Choose a system built with your specific workflows in mind, like table service and delivery for restaurants, inventory management for retail stores, or commission tracking for beauty studios. Generic tools may require costly customization or add-ons to meet your needs. Square offers built-in solutions for each of these industries, so you can get started faster without paying extra for specialized features.
- Ecosystem and integrations: Consider how easily the system connects with your existing tools, such as accounting, marketing, or payroll software. A strong ecosystem minimizes setup and maintenance costs. Square integrates with more than 400 third-party applications while offering built-in tools for core features like marketing and payroll, reducing the need for paid integrations.
- Support: Look for responsive support and customer success resources. Square provides 24/7 support and a knowledge base of helpful guides and training materials to help you troubleshoot issues quickly.
- Scalability: Think about what the system will cost and deliver as your business grows. Some vendors price aggressively at first but scale poorly when transaction volume, staff, or locations increase. Square is designed to grow with you. It’s nimble enough to support a one-person store and powerful enough to power a 90-plus-store franchise.
Tools like the Square Business Technology Partner Comparison Tool can help you compare features, hardware, and service options side by side before making a final decision. Combined with your TCO analysis, this framework helps ensure you choose a solution that’s cost-effective, reliable, and built to grow with your business.
Best practices and common mistakes when calculating TCO
A total cost of ownership analysis is only as good as the data and assumptions behind it. Taking the time to gather accurate information and stress-test your numbers can mean the difference between a confident decision and an expensive surprise later.
Best practices to follow
These will help you build a more accurate, dependable TCO model.
- Bring in multiple perspectives. Involve finance, operations, and IT teams from the start. Each department sees different costs and risks that others might overlook.
- Use real data. Base your model on actual transaction volumes, staff counts, and costs from your business instead of generic estimates. The more realistic your inputs, the more reliable your results.
- Plan for three to five years. A multi-year view reveals renewal costs, scaling trends, and end-of-life expenses often hidden in first-year calculations.
- Compare at least two or three vendors. It’s the comparison that reveals hidden fees and value differences. Without it, you’re only seeing half the picture.
- Stress-test your assumptions. Run both high-growth and low-growth scenarios to see how sensitive your costs are to change. This helps you plan for uncertainty and make more resilient decisions.
Common mistakes to avoid
Keep an eye out for these mistakes. They’re easy to make and can throw off your entire analysis.
- Focusing only on upfront costs. Low sticker prices can mask ongoing fees, tiered add-ons, or contract penalties. Look beyond the first invoice.
- Overlooking multi-year pricing. Some vendors offer discounted rates for the first year but raise fees significantly later. Always calculate total ownership over three to five years to see the real long-term cost.
- Ignoring hardware lease terms. Leasing equipment may look affordable at first, but leases often come with long-term contracts or balloon payments that make switching expensive. Review the fine print before committing.
- Underestimating growth. Many businesses choose software that fits today but becomes unaffordable as they add staff, locations, or transactions.
- Overlooking exit costs. Early termination fees, data migration, and retraining for a new system are real expenses that need to be part of your model. Ignoring them can make switching vendors costly and disruptive.
- Failing to document assumptions. Without clear notes on where your numbers came from, your model becomes harder to update or justify later.
- Ignoring vendor behavior. Opaque pricing, limited integrations, or weak support all inflate costs over time. Evaluate not just the software, but the vendor’s transparency and reliability.
By combining a disciplined TCO analysis with sound judgment, you’ll make technology decisions that hold up over time.

Choose technology that pays off long term
Every technology decision you make shapes the future of your business. The right tools help you free up time, improve efficiency, and create room for growth.
Understanding the total cost of ownership of your business technology helps you make more informed choices. A proper TCO analysis gives you a clear view of what each tool will truly cost and what it will give back over the life of your business. When you weigh features, support, and long-term value alongside price, you can invest more strategically in the tools that offer the best return.
Square provides the transparency you need to make confident TCO calculations. You can see every cost upfront, access almost all the features you need within one system, and scale at your own pace without worrying about hidden fees or long-term contracts that hold you back. By choosing a technology partner that simplifies ownership, you can lower your total cost, increase efficiency, and gain back time to focus on what matters most: running and growing your business. Contact our team today to see how Square can help you run a leaner, more efficient business.
![]()