
Table of contents
How do you answer the question: Is my restaurant doing well?
When I opened my first restaurant, I had a lot to learn about business performance metrics. With a background in accounting, I knew profit was critical to cash flow, which I could use to reinvest in my business. But was I on track to overall profitability? I had no idea, so I relied on my CPA, Saul, at the time.
I quickly learned that looking at your bank account to measure success can be a slippery slope. You could easily say, “There’s money in the bank; I must be doing something right,” especially if that number is generally going up and not decreasing over time. But a bank statement is a result of several other business decisions: how much you spend on ingredients, what menu items you choose to sell that season, and at what cost. Ultimately, my goal was to open multiple restaurants, but if I simply accepted my bank balance and didn’t investigate the small decisions that would put me in a better position for expansion, I’d never reach my full potential.
Today, competition is sky-high for restaurant owners. Last year, new restaurant openings were up 10% compared to 2022, according to Yelp data. And Square data tells us that over the next 12 months, restaurant owners are even more focused on growth and expansion than years before. If you’re starting or expanding your business in today’s climate, there are numbers that are critical to monitor. Some are evident, such as your weekly sales numbers, while others, like the costs associated with your food and beverage split, may be less obvious. In my role heading up the Square restaurant product suite, I’m obsessed with making sure restaurant owners can get their hands on the metrics that matter most easily, quickly, and regularly. It’s what helps us keep our businesses afloat and turn hypothetical growth into reality.

So, what metrics matter most when you’re opening a restaurant?
There are two core business metrics that are important to pay attention to as you’re opening a restaurant: your prime costs and your bottom-line profit.
Let’s unpack the prime costs. These are the costs you spend producing the menu items you sell. This includes the total cost of labor and the cost of goods sold, or what you pay for ingredients. Starting with labor costs, this encompasses everything you spend on your team. In addition to hourly wages, think of things like benefits and payroll taxes (local and Uncle Sam). For ingredients, this is everything you are putting on the plate or in the glass for your guests to eat or drink.
Then you have the rest of your operating expenses, such as rent, utilities, and your direct operating costs, which are items like toilet paper, towels, and laundry. Glassware, too, is included here, though take into account that you’re not replacing all your glasses every week. Additionally, what you spend on technology, financial services, credit card processing, commissions to third-party delivery, commissions to your reservation OpenTable system, marketing, and PR are all going to fit in a remaining bucket.
I know that’s a lot, right? There are so many factors before we get to the bottom line, which makes our business so challenging. Being on top of all of these things is where the money is made.
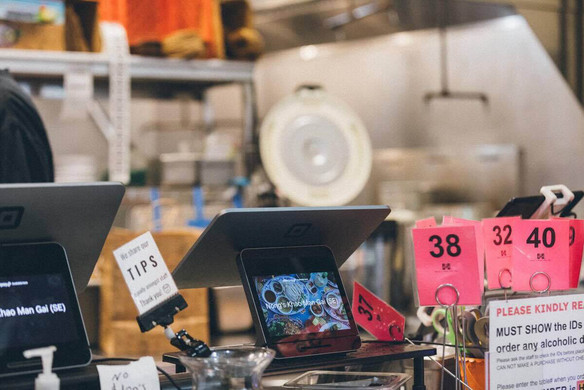
Shifting to bottom-line profit, I like to take a look at things like food and beverage splits to get a full picture. If you’re a full-service restaurant with a liquor license, for example, you could ask yourself, ‘How much of my beverage sales are alcoholic?’ and then, ‘What do those margins look like?’ It could inform decisions like whether you want to continue serving certain liquors or scale back or increase quantities. Another metric that many restaurant owners look at is sales per labor hour, or even sales per square foot, to make sure staffing and building costs are sustainable. These numbers can all vary drastically, but the idea with each is that you’re tracking these numbers with the goal of trying to improve them every week.
I know from first-hand experience, though, how little time there is to review business performance between overseeing staff, helping prepare for service, and marketing the business. I overcome this by scheduling reviews once a week. Not only does this keep me regularly up to date on how the business is doing, but it also provides a more accurate picture. For example, Mondays are not as busy sales days as Fridays, making it unwise to compare those two days against each other as a measure of success in the first place.

Understanding what to strive for while evaluating the health of your restaurant business
Now that we’ve identified what metrics to look at, the next question is, ‘What does this all mean?’ A good rule of thumb is to try to keep your prime costs under 65%. While this is ideal, it will likely vary depending on whether you’re running a quick-service or a full-service restaurant. Some best-in-class restaurants, for example, are closer to 50%.
According to the National Restaurant Association, what’s leftover, known as your overall margins, is typically between four and six percent. I like to aim for 10% — it’s a really hard number to hit, but not impossible with the right technology.
In the early days, my team tracked this information with pen and paper. Every month, my accountant produced a report that covered my financial statements, a P&L (profit and loss). And that’s how we knew whether or not we were doing well. The problem, however, was that a month is a long time. It means you get just 12 shots at determining whether you’re in a good position or not over the course of a year.
I wanted to figure out how to get signals sooner, and it became my goal to understand how technology could help me estimate what business performance looks like on my team’s weekly basis.
Using your restaurant tech to temperature check your business’s health
Since joining Square as GM for Restaurants, I’ve been keeping my pledge to help restaurant owners access the information they need. It’s why table-stakes reporting capabilities come directly built into the POS system with Square for Restaurants—no extra add-on. As a user, you can access several reports, including gross sales, refunds, and net sales summaries. It’s also easy to compare trends based on daily, weekly, or yearly gross sales averages. And if you operate multiple locations, you can view this data holistically or choose to select individual locations to review.
Restaurant owners have particular needs, which is why we built restaurant-specific reporting capabilities into the product, including open-section sales reports. This gives you the ability to compare sales from, let’s say, the bar with sales from the patio. If you’re tracking sales per square foot, you can use this information to make decisions about rearranging your floor plans to help reach higher sales volumes. We also built kitchen performance reports, which tell owners about ticket counts and average completed ticket time across all devices and locations. This way, you no longer have to wonder if your kitchen is operating efficiently. And you can take action, such as adding more staff to improve performance.
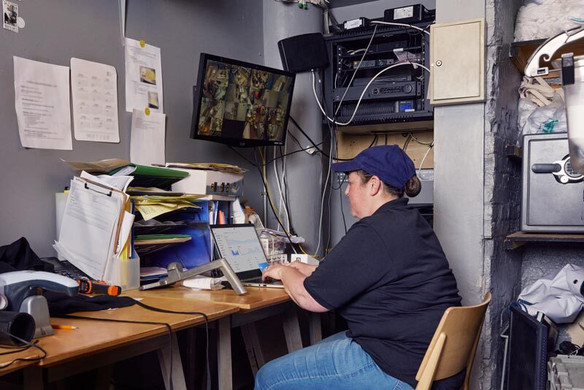
Every restaurant owner needs to have access to these reporting capabilities to make informed business decisions. What’s uniquely empowering, however, is the ability to have it readily at your fingertips. What I love about what we do at Square is that restaurant owners can access reports via their POS, desktop, or even a mobile app device, meaning even if you’re away from your restaurant, you can still see how things are running.

When it comes time to take action on that data, such as adjusting your item inventory, making staffing updates, and communicating changes to the team, it’s easy because owners have tools that work together seamlessly.
Take Square Inventory Management, for example. This tool uses your sales information to flag when items start to run low, which you can then use to update your menu accordingly by 86ing menu items that are no longer available. With Square staffing tools, you can rely on your Dashboard data to inform any changes to the schedule you need to make, then quickly toggle to Square Shifts or Square Team Management solutions to make necessary changes and communicate them with your team. And if you have other partner solutions you love, we offer the ability to integrate best-of-breed third-party partners with your Square account, so your tools are always working together for you.
Try it yourself
Understanding the metrics that drive your business is crucial to staying ahead. Get a deeper look into the trends shaping the future of the restaurant industry in the 2024 edition of Square’s Future of Restaurants report.
Keeping your restaurant on track for success
Ultimately, Square restaurant users don’t just get the information they need but also the ability to act as soon as possible so that growth becomes possible. As you’re launching your first restaurant, opening another location, or simply investigating how things are running, remember that the number one thing you can do as an operator is access your business data on a more frequent basis. It’s not about having a perfect month. It’s about how swiftly you correct any mistakes. Ultimately, that’s what becomes possible with a reliable tech platform like Square.

![]()