
Table of contents
Being a business owner means you’re constantly on the move. Running to one location to interview a new barista, jetting over to a catering gig to make sure everything’s all set up. You rarely have time to sit down, let alone sit at your computer to check in on how business is going. “What are the most popular items selling today? Should I stay open an extra hour?” Such questions are crucial when you’re running a business. More than 70 percent of larger businesses taking payments with Square use Square’s analytics on a daily basis.
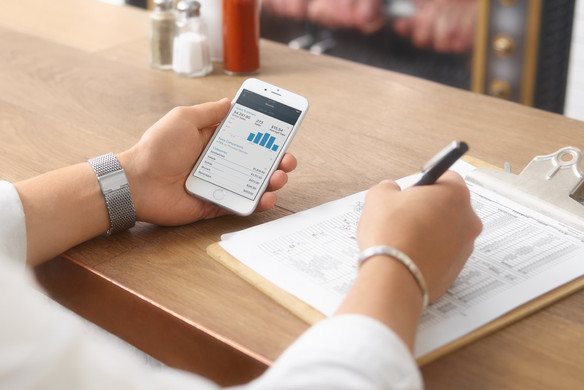
We think you deserve to have the information you need, when you need it, wherever you are. Now there’s an app for that. The Square Dashboard app gives you real-time data about what’s going on at all your locations — straight from your mobile device. With just a tap, you get instant insight into what’s running smoothly, and what might need some tending to.
What can you see? Well, for one, you can watch your sales — as they’re happening. Which may be even more addicting than Candy Crush. Sellers in our beta program opened the Square Dashboard app 12 times a day on average to keep a pulse on things. That’s more than once an hour during a regular business day.

But the app goes way deeper than real-time sales. You can also get information on things like:
Your sales summaries
Check your sales, the number of items you sold, and the average sale amounts each day. So if you’re hitting it out of the park, you can see that right away.
Sales comparisons
Compare your sales to last week, last month, or last year. This information is gold when it comes to figuring out when to staff up or down.
Which items are your best sellers
What are you selling more of — clothing or accessories? You can instantly spot which categories are doing well, and which might need some TLC with a sale or a promotion. You can also sort your items by what’s selling, or what’s not. If you’re serving tons of iced coffee and another heat wave is approaching, it might be time to make some more ice.
How all your locations are doing
You can choose to see sales data at one location, at all your locations, or at any group of locations. This is a great way to get a quick take on how things are going across the board at any given point in time. It’s like being everywhere at once. Except not.

All of this readily available data can help you make informed decisions about how to run your business. Sidecar Coffee owner Andy Fuchtman, for example, checks the app every couple of hours, especially when he’s away from the shop. “I get up, check my email, and check my Dashboard app,” he says. “If I see sales spiking, I’ll add a barista in real time.” He even uses the app to test out new initiatives. “I experimented with a Cappuccino Happy Hour and after measuring its success, it’s now a regular thing,” he says. “We love coffee and and want to be here in five years, ten years. To be able to do that, we need to make smart decisions. Square’s data helps us do that.”
The Dashboard app (which is compatible with iOS 7 and iOS 8) is now available for download in the App Store. And it’s free.
Download the Square Dashboard app for iPhone or learn more here.
![]()


