


As costs climb and margins shrink, business owners grapple with tough questions: How do customers, who are also feeling economic pressures, decide where to spend their dollars? And what can businesses do to turn one-time customers into loyal regulars? To find out, we analyzed anonymized Square transaction data across the U.S. and surveyed nearly 1,000 Americans. This report reveals how shared loyal customers stabilize local economies and how, by understanding customer behaviors, you can strengthen customer relationships, grow your business, and ultimately contribute to a thriving neighborhood.
Key terms
- A regular: A customer who has purchased from the same business on at least four separate days within a one-year period.
- A network connection: When two businesses share at least one regular customer.

49%
of consumers say they make purchases at local retailers and restaurants in their ZIP codes several times a week4
Over the next 12 months, 24% of customers plan to shop and dine locally more often, a good sign for business owners.5 Local businesses that share regular customers with nearby businesses tend to have higher annual revenue.6
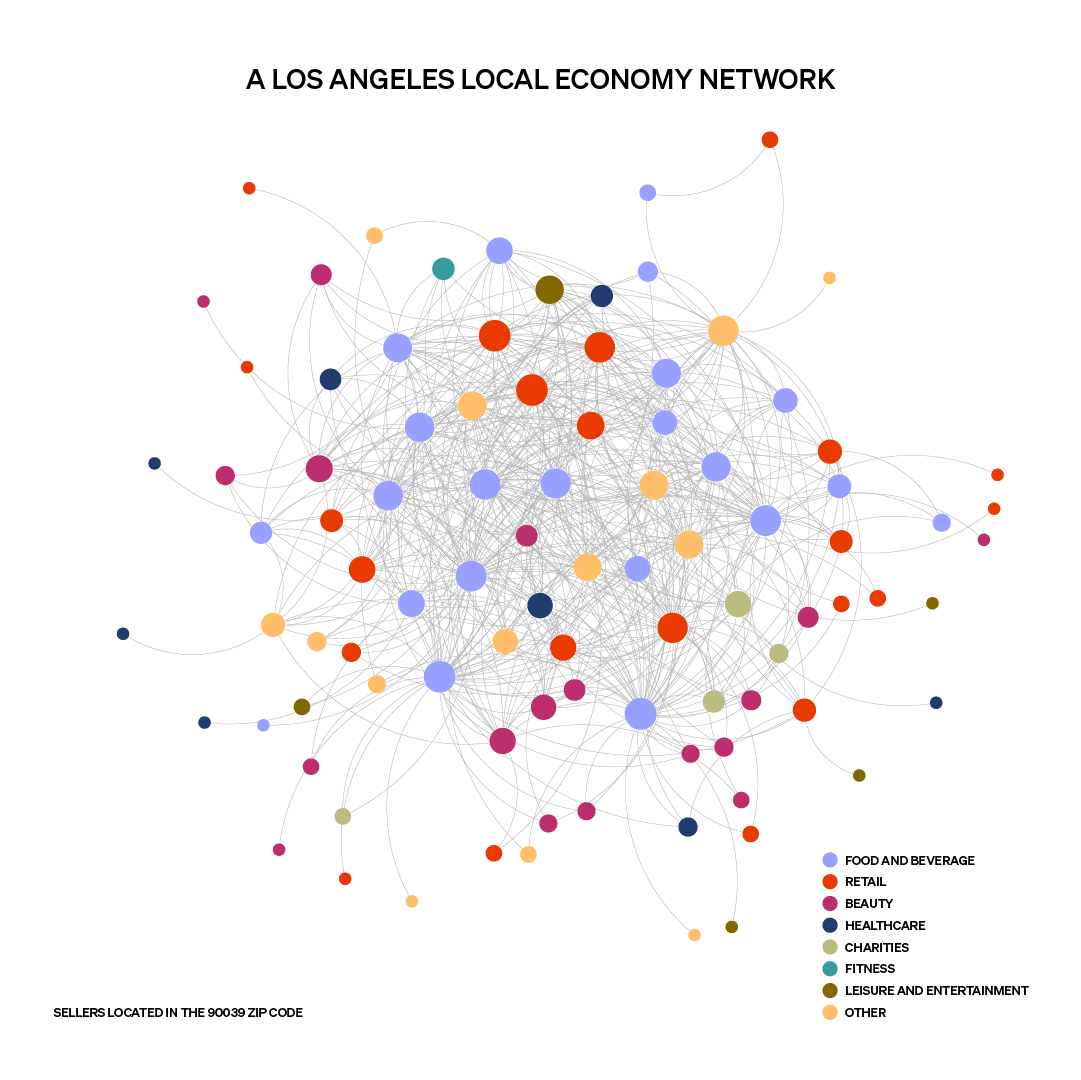
In Los Angeles, for example, businesses with more network connections tend to have higher annual revenue — on average, $2,201 more per connection. In Chicago, New York, and San Francisco, the revenue lift ranges from $1,100 to $2,025. Simply put, more connections mean more revenue for your business.
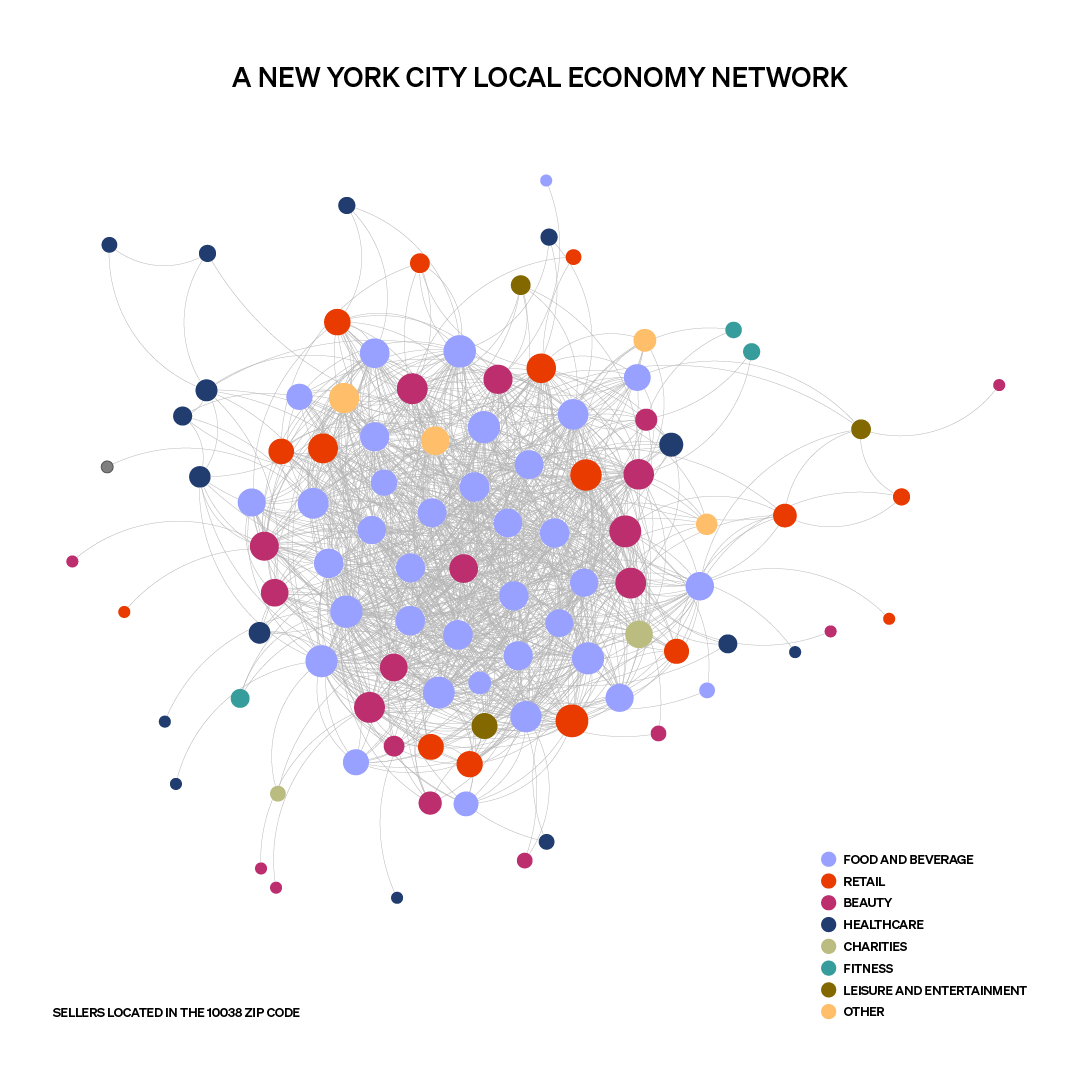
The visuals below show anonymized networks of neighborhood businesses connected by shared regular customers, rather than roads and intersections. Food and beverage businesses are common connectors, but every neighborhood is unique.

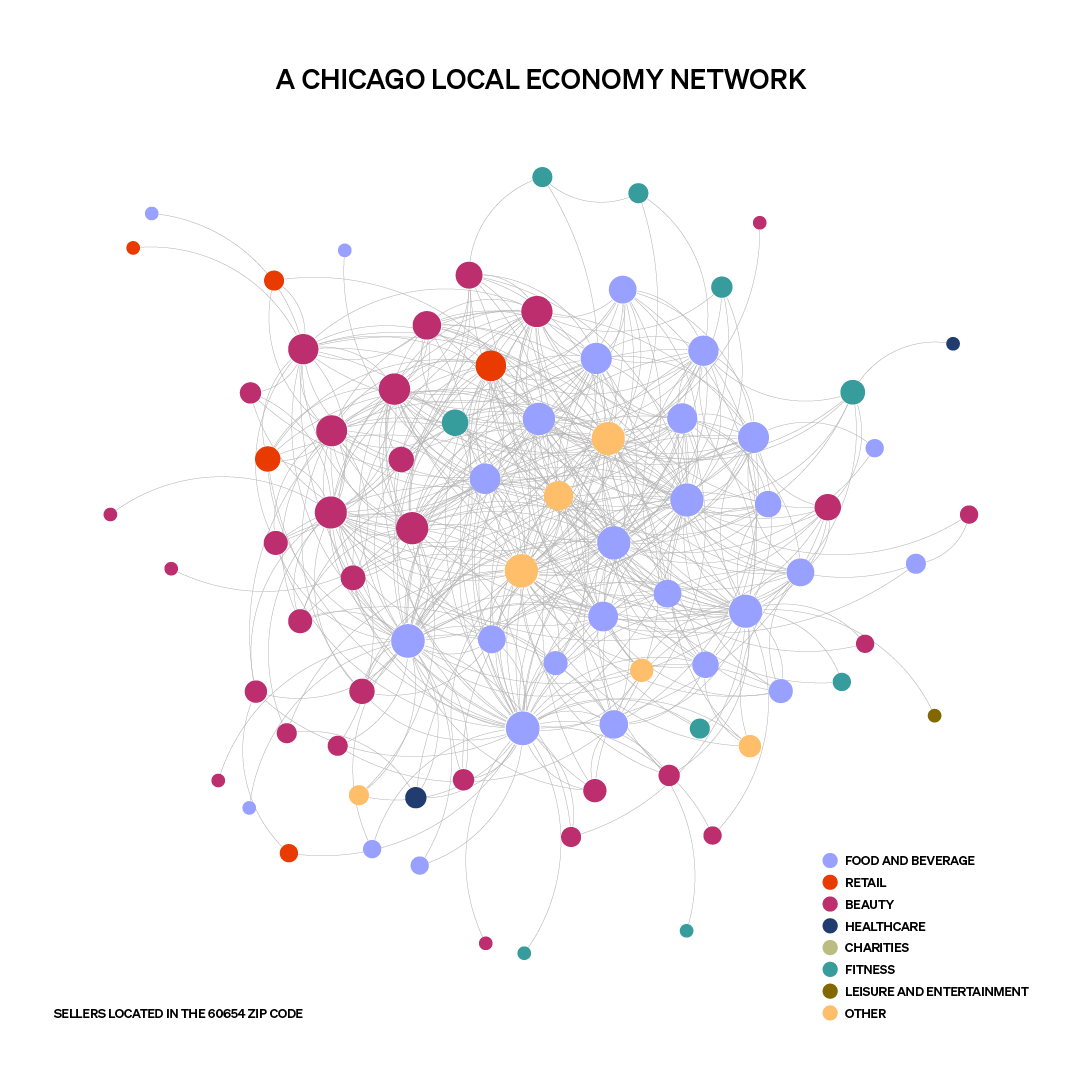
In San Francisco’s Richmond neighborhood (94121), one path through the network of shared regulars links a hair salon to a nearby coffee shop, which connects to a dessert shop. In River North, Chicago (60654), shared regulars connect a hair salon to another beauty business, then to a nail salon, a casual restaurant, and a physical therapist. The takeaway? Customer loyalty connects businesses across industry lines. Interestingly, coffee shops, we found, tend to share regulars with other business categories the most — underscoring their central role to local communities.
“Neighborhoods aren’t just a collection of individual businesses; they’re interconnected networks where success is shared,” said Nick Molnar, Global Head of Sales & Marketing at Block. “When a coffee shop thrives, the salon next door benefits. When regulars support one business, they’re often supporting five others in the same ZIP code.7 The future of commerce is local, and Square helps sellers understand and activate these neighborhood connections. Because when local businesses win together, entire communities thrive.”
The new local playbook: Outposts, activations, and shared regulars
Expand reach: Green Apple Books has multiple locations in San Francisco, and it reaches even more customers by operating a pop-up store inside a popular bakery, Devil’s Teeth Baking Company downtown. This bakery outpost is “great marketing for Green Apple because there are no bookstores downtown,” co-owner Peter Mulvihill said. People go into the bakery, get excited when they see Green Apple’s selections, and soon, “they come checking on one of our other stores.”
Build local love: In the Highland Park area of Los Angeles, Civil Coffee hosts block parties with neighboring businesses. When customers visit Civil Coffee plus the nearby clothing store, bar and bowling alley, they get a special reward at each stop. It fosters a sense of community. “We see a peak of sales, because [customers] come out for that activation. But it’s more about making sure you’re capturing their attention constantly in a world where there’s always something else opening up,” said co-owner Alan Morales.

Regulars drive six times the annual revenue through consistent spend and higher tips
Staying top of mind with regulars is a business strategy that pays off. On average, regulars return more consistently — even in challenging economic times — and they tip at higher rates. For businesses across U.S. cities, the compounding effect of regulars’ spending makes a pretty dramatic difference in the long run.

11%
higher average tips from regulars compared to transient customers8
Locally, this gap is even wider in Atlanta, where regular customers are worth 7X the annual revenue of a transient customer.
While transient customers and one-time purchases are a critical revenue source, the regulars who keep coming back, especially during economic instability or downturns, are essential to a lasting local business. National revenue contributed by regulars peaked in 2020 at the height of the pandemic.9 But even today, long after the pandemic’s initial impact on local economic behavior has subsided, revenue from regular customers has grown while transient revenue has declined.

6X
annual revenue per regular compared to transient customers (national average)10
New foot traffic boosts sales, but your regulars carry you through hard times and peak seasons alike. “Regulars are massively important,” Morales said, adding that regular customers often come into Civil Coffee three to five times a week. “[Regulars] spend so much more, even if it’s just once a week.”
How to lock in future revenue with pre-bookings
How do you nudge a customer to become a regular? Don’t let them forget to return.
Tactic: End each visit with a future commitment already on the books. That’s how you build a customer base that you can count on.
Execution: “I’m always pushing to rebook before you leave, because I want all regulars, all consistent clients.” — Brandon White Owner, Brass Tacks Barbershop, Dallas TX
How to win by driving repeat purchases
So, regulars are essential. But what builds regularity in the first place?
First, consumer trends tell us regulars often return to local businesses for the same products and services. Across nine major cities we studied, regulars in every sector except retail are significantly more likely to re-buy their favorite item.

59%
of the time, regular customers make the same food and beverage order11
78%
of the time, regular customers buy the same beauty products each visit12
Product quality and consistency are key, especially for food and beverage and beauty business owners where repeat purchase rates are high. And by knowing these purchasing patterns, owners can make changes to their menu and prices that protect customer loyalty and their bottom line.
R365: Loyalty insights helped operators keep a 60/40 prime cost–prime profit mix
Across the 2025 period, prime cost consistently hovered near 60% of sales, with prime profit near 40%, despite sustained food and labor inflation. By pairing Square real-time sales and loyalty signals—including guests who reliably reorder the same favorites—with Restaurant365’s recipe and costing intelligence, operators could nudge prices, portions, and menu mix just enough to protect that roughly 40% prime profit without breaking the experience for their most loyal customers.13
Retailers, on the other hand, may benefit from a rotating inventory that keeps offerings fresh for customers who are more willing to try new things.
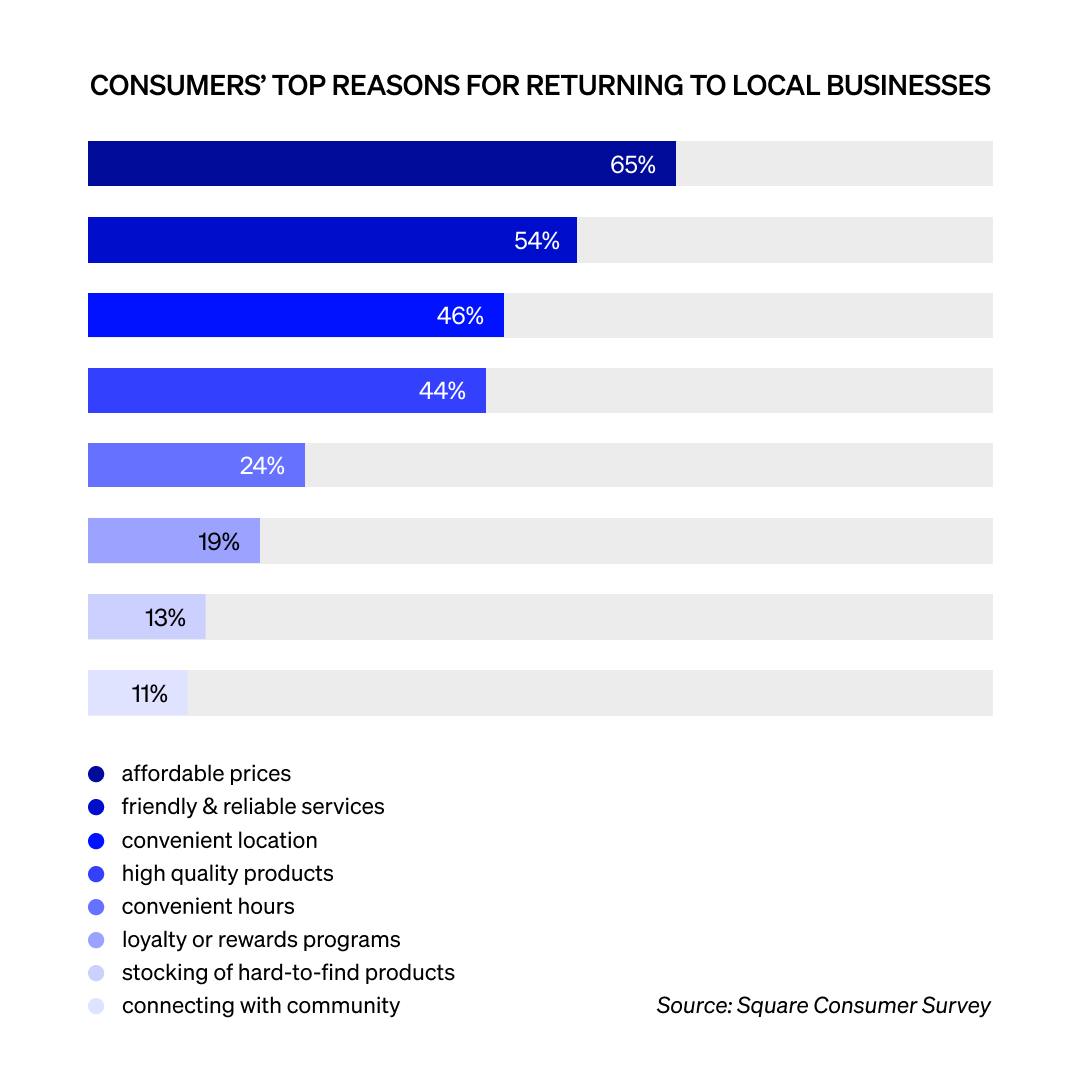
Still, building consistent loyalty is about more than what is on the menu. To consumers, affordable prices are king. Feeling recognized and valued are other key reasons that keep them coming back to local businesses.
Overall, regular customers and repeat purchases are the steady heartbeat of a local business. Regulars’ loyalty creates a predictable floor for your revenue. But the shifting national economy is forcing consumers to think critically about how they spend. To stay ahead, you need to know what levers you can pull to keep your business top of mind with consumers.


56% of consumers say staff expertise makes a local business memorable
Nationwide, consumers visited more local businesses in 2025. And looking ahead, 33% of surveyed consumers plan to shop and dine more in-person over the next 12 months, compared to 20% plan to do so online.14 What’s bringing customers in? Across industries, convenience may spark a first visit, while staff’s expertise and product knowledge make shopping locally memorable.

56%
of memorable customer experiences are thanks to knowledgeable staff15
Demand for shopping locally is rising, but where customers shop most varies. Sixty-one percent of consumers told us they visit retail stores in their neighborhood the most, followed by quick-service restaurants (59%), and full-service restaurants (46%).16 And nationally, the average customer visited more retailers in 2025, reflecting their willingness for variety. On the other hand, customers visited fewer beauty businesses, which may indicate deeper loyalty.17
Throughout 2026 and beyond, one major differentiator in capturing customer attention will be the expertise you provide about your products and services. Consumers rank this highest on the memorable-experience scale, outpacing personalized experiences (43%) and the business’ atmosphere (53%).
“At Square, our research has long shown that local economies thrive on relationships – between customers and sellers, sellers and their staff, and even between neighboring businesses themselves,” said Christine Kahm, Head of Customer Strategy at Block. “And now, with this data analysis, we’re further reinforcing that these connections aren’t just feel-good stories, they’re measurable drivers of revenue and resilience. Our unique vantage point across millions of transactions reveals the true anatomy of a neighborhood network: businesses that share regular customers earn thousands more in annual revenue. It’s these relationships – built on consistency, loyalty, and community – that underpin and power a thriving neighborhood network.”
The local’s playbook: How to highlight your expertise
In the beauty industry, expertise can look like knowing what your customers want and adjusting your offerings accordingly. “We’re already seeing a major shift in customer frequency around hair coloring, and we’re seeing a shift into wellness,” said Dallas salon owner Tori Rutledge when asked about her industry predictions for 2026. “Many salons, including my own, are offering head spa services to appeal to the wellness-focused clientele.”
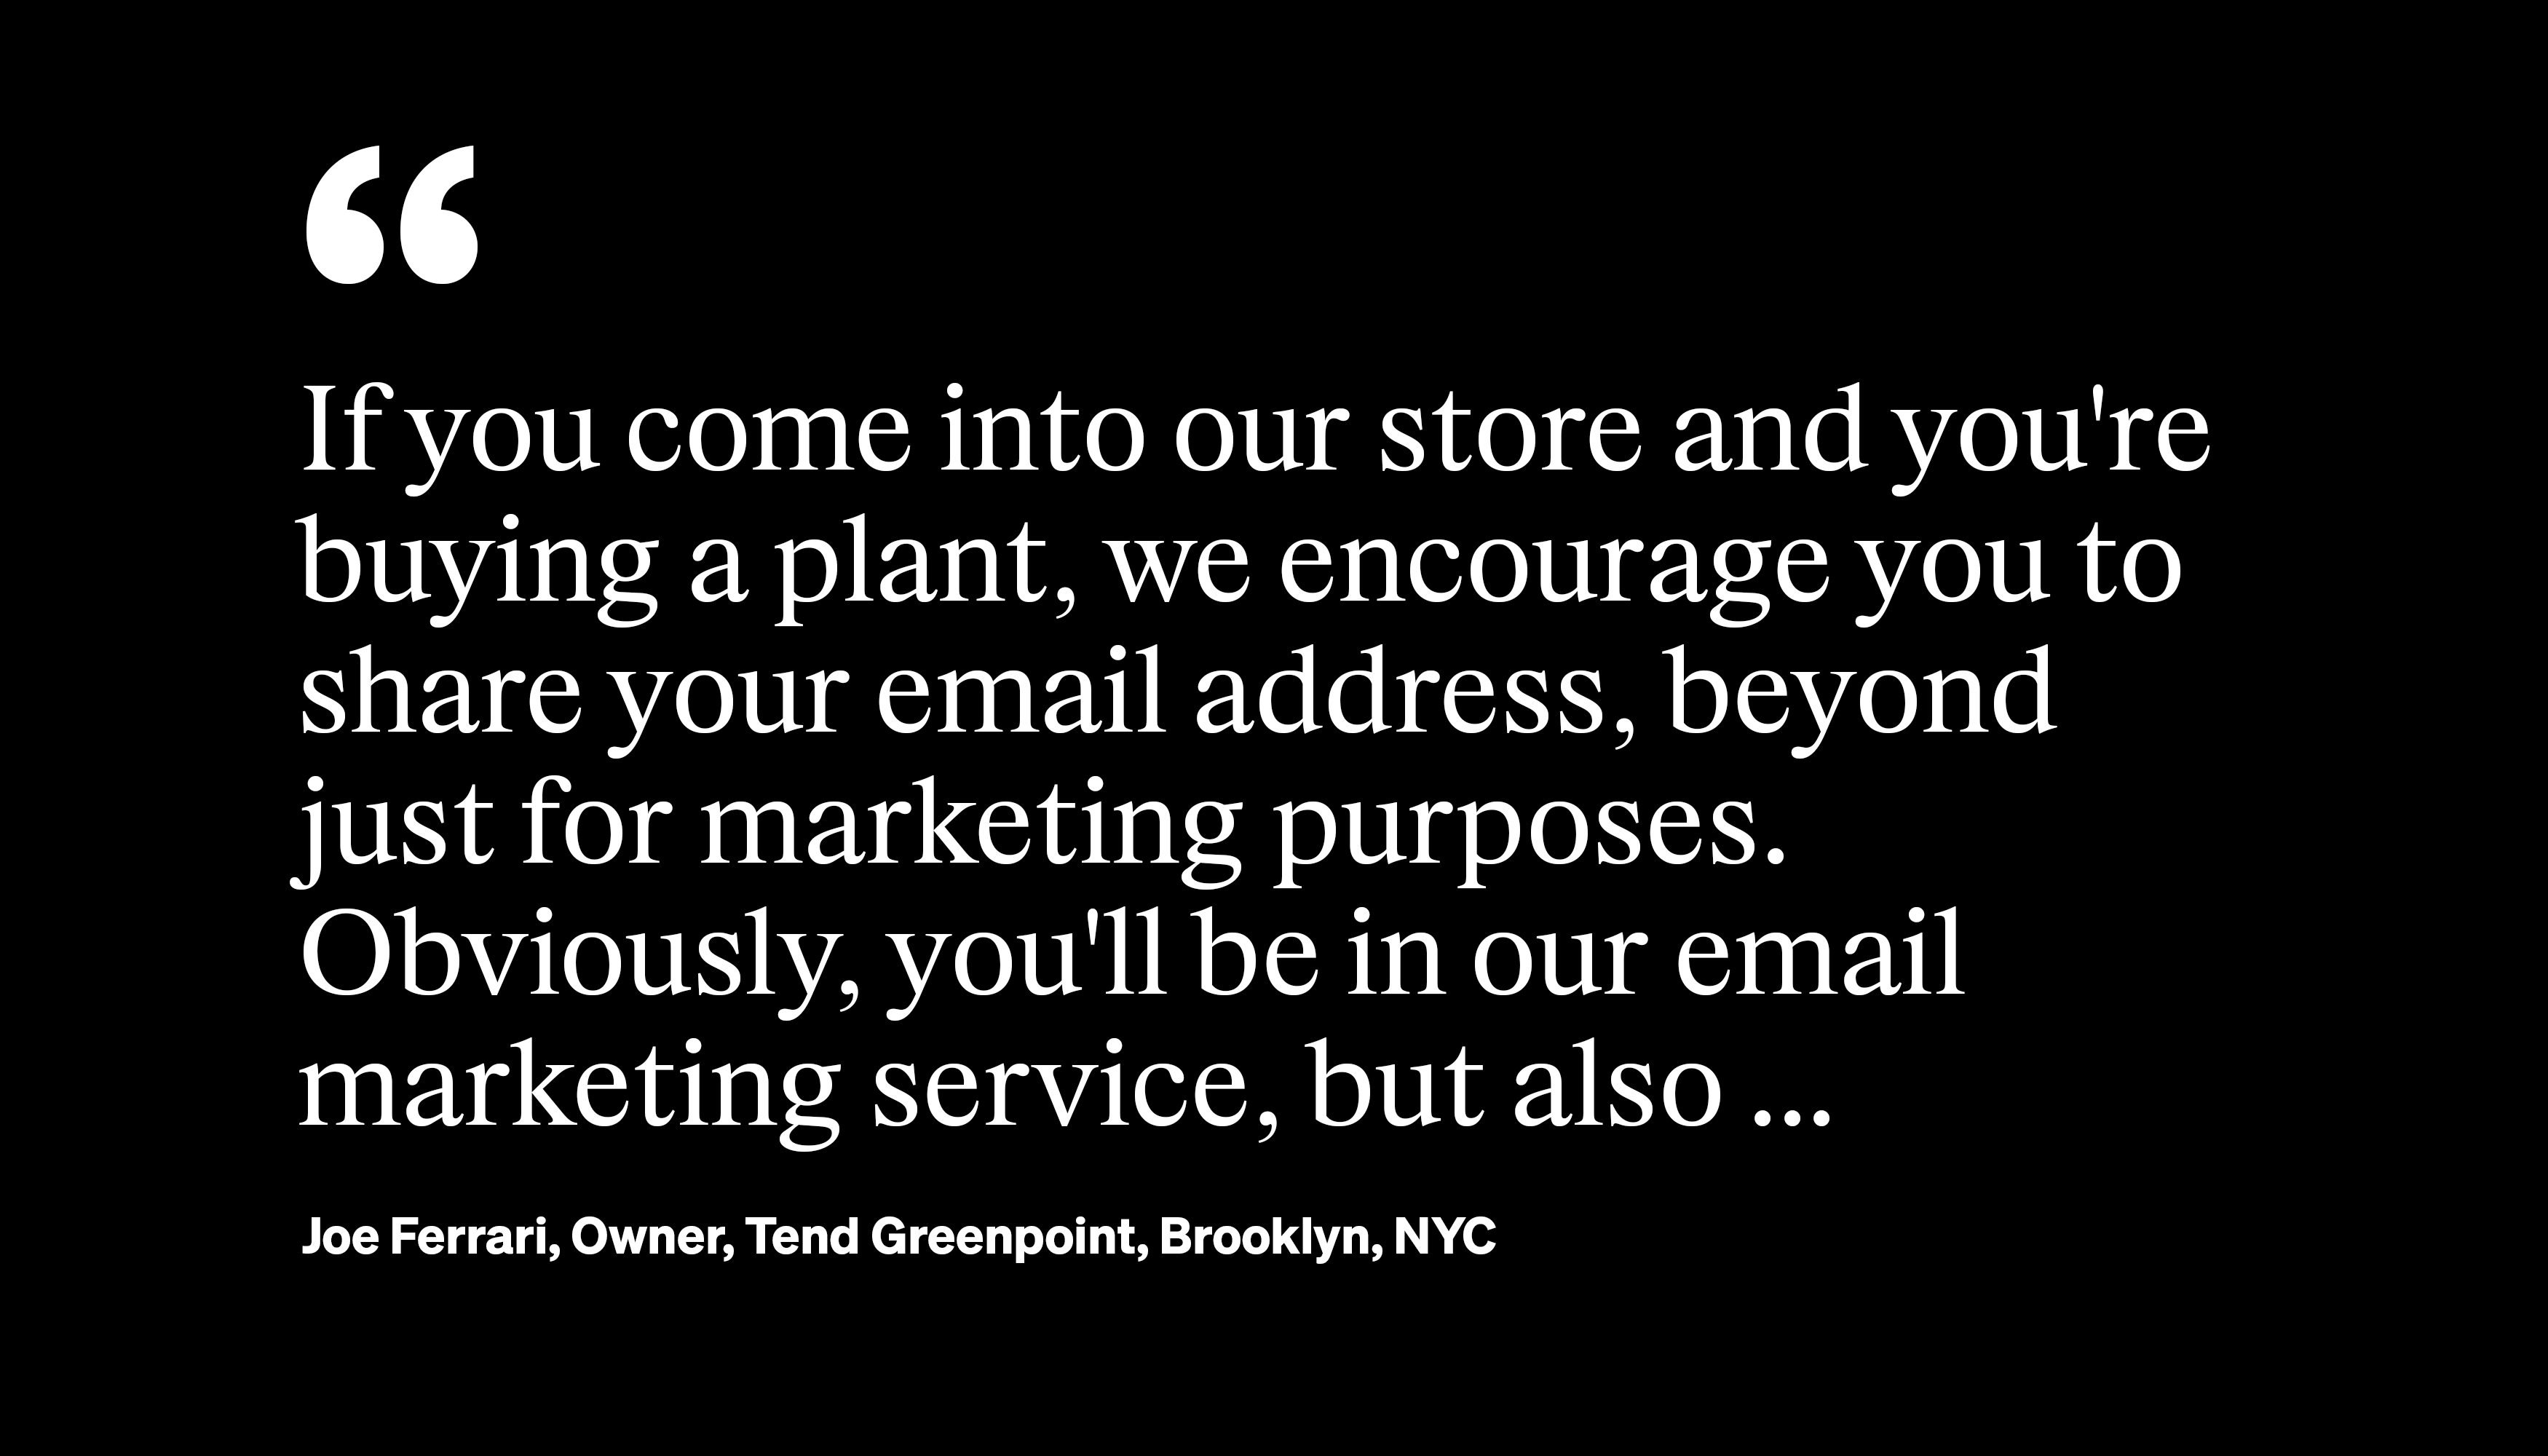
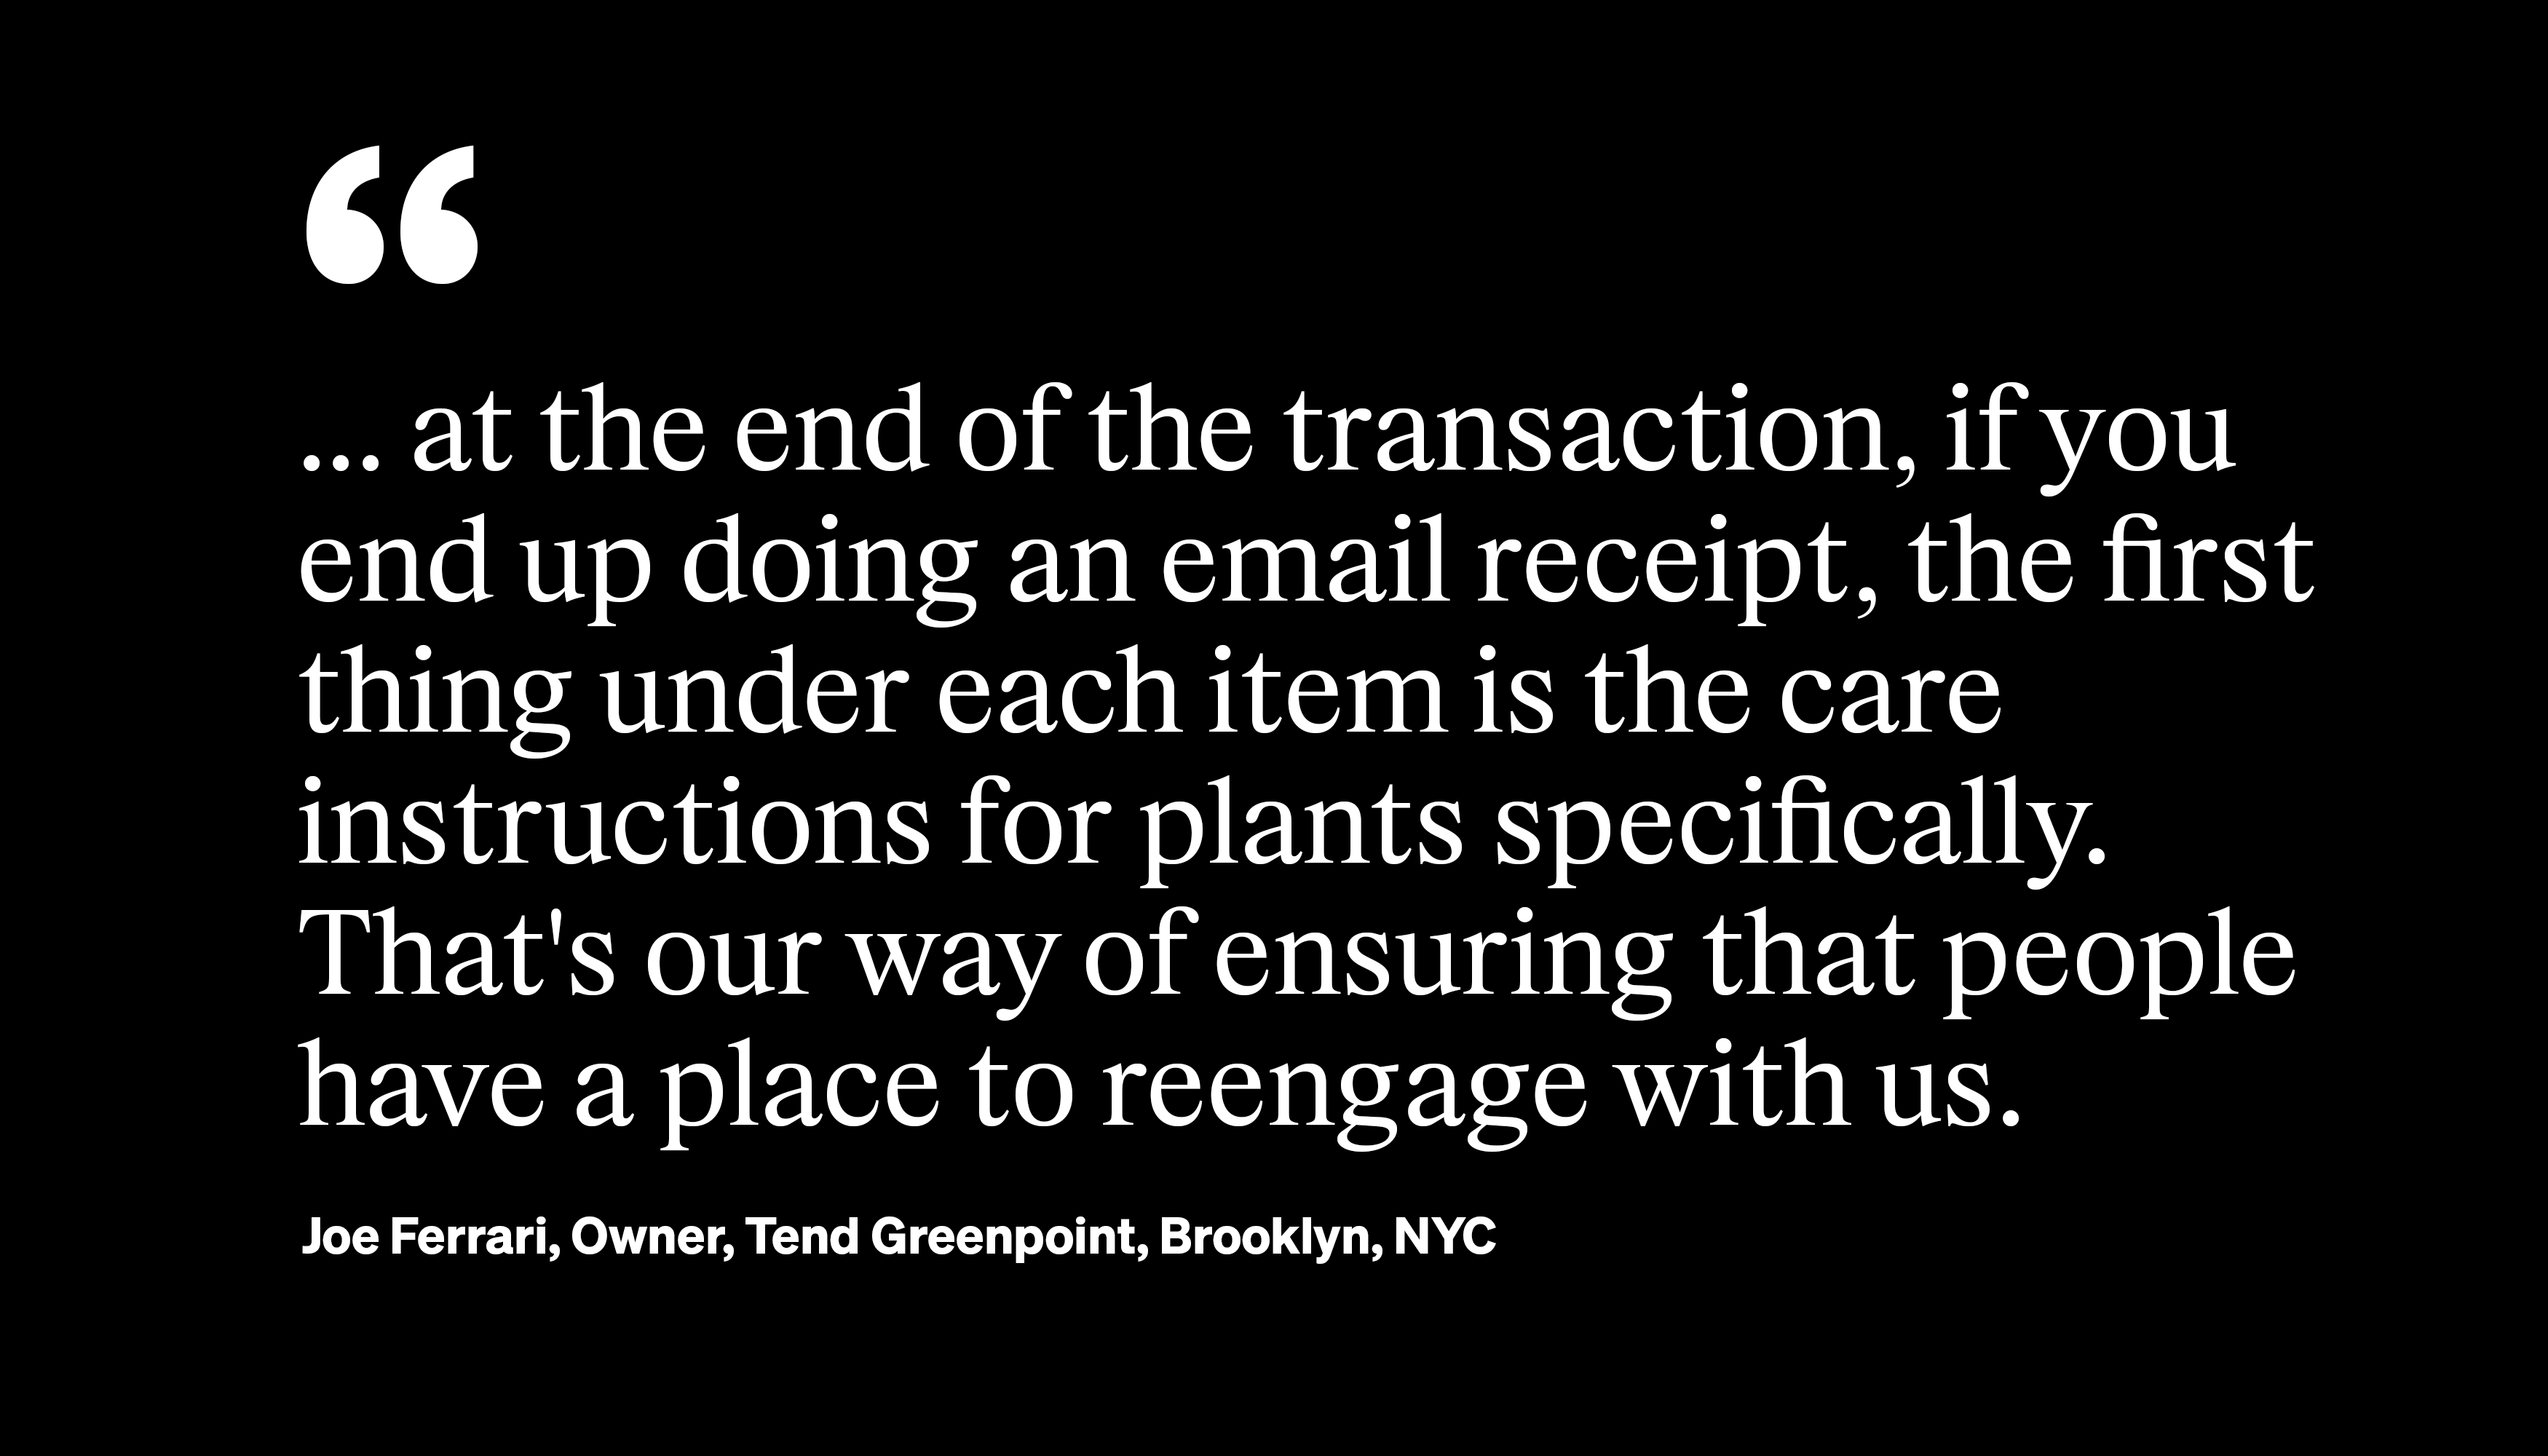
For retailers, staff knowledge can take a different shape. For instance, Brooklyn plant shop Tend Greenpoint embeds product education into the checkout experience. With each purchase, customers receive care instructions printed directly on their receipt, which inspires customers to stay connected with the business.
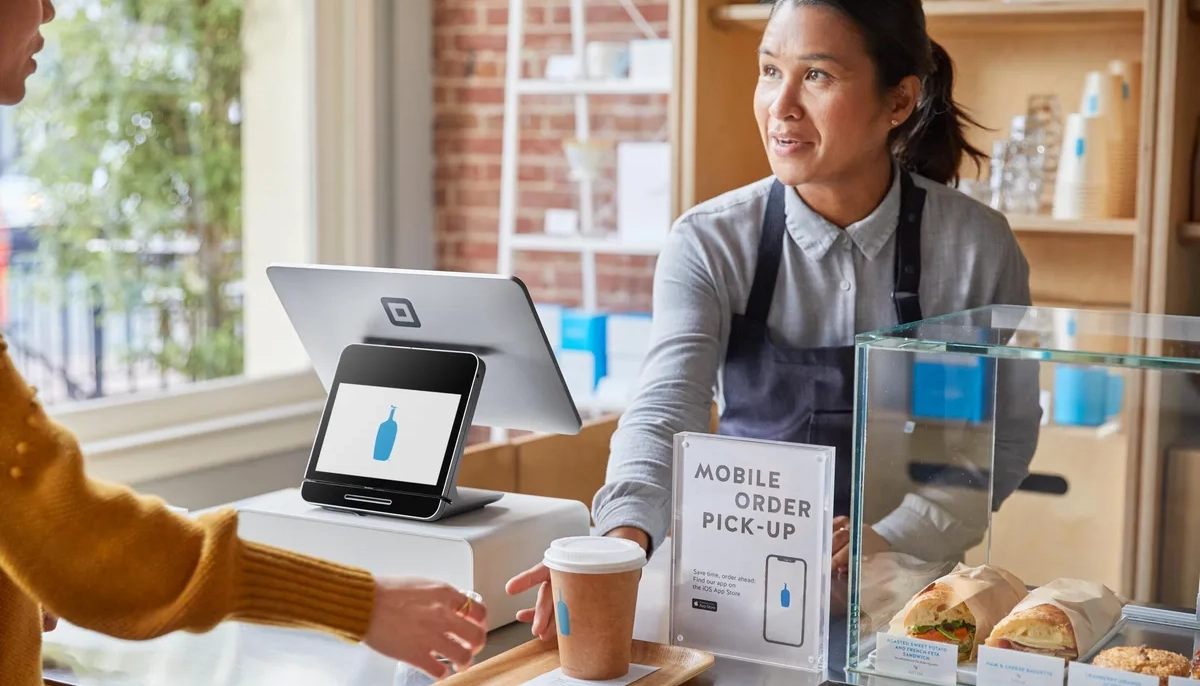
Delivery and in-store pickup drive new demand
Consumers also expect flexible ways to shop. Investing in the Tend Greenpoint website recently helped owner Joe Ferrari reach even more customers after winter weather impacted foot traffic. “Last year, we launched local delivery, and that really helped our business a ton,” he said. “Our e-comm business has grown so much, and that’s keeping us flat.”
Tools that make a difference
Which of the following digital tools or services would make you more likely to frequent a local business?
-
Delivery or in-store pickup options — 44%
-
Mobile payment options — 39%
-
Digital loyalty program / loyalty app — 39%
-
Online reservations / booking — 29%
-
Digital gift cards — 26%
Source: Square consumer survey
Digital tools and thoughtful touches keep your daily operations organized. They solve for convenience and remove friction for your customers. But alone, they don’t guarantee business growth. Your expertise has to be a consistent conversation, and marketing strategies separate thriving businesses from the rest.

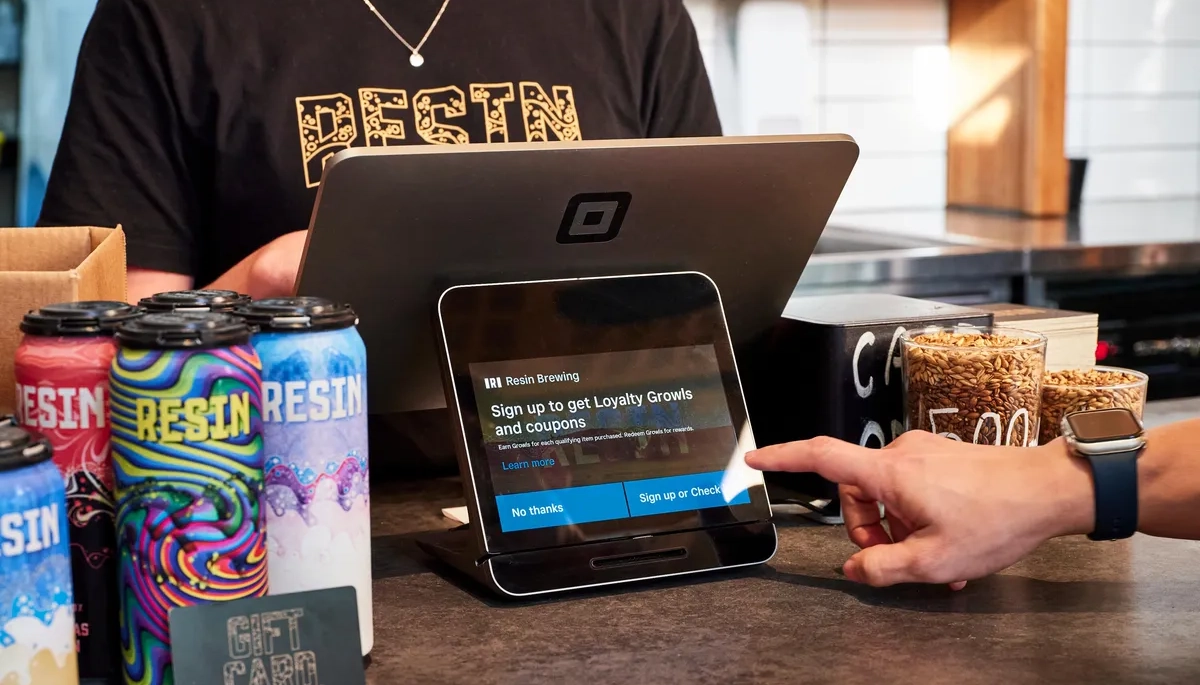
Marketing tools are tied to a six times daily order boost and a two times daily revenue lift
Convenience, expertise, and preferred product availability drive local spending, but before consumers spend, they need to discover your business. Nearly one-third of consumers (30%) say lack of awareness keeps them from shopping or dining locally.18 And a clear line separates businesses that engage their customers and those that stay silent. Marketing platforms bridge that gap. They allow you to stay top-of-mind when it matters most.

90%
of local businesses using a marketing tool in 2025 successfully maintained regular customers, compared to only 38% of those that didn’t use a marketing tool.19
Local businesses using marketing products see an average of six times more daily transactions than those that don’t. In New York City, the difference is even larger: local businesses using digital engagement tools see 11 times more daily transactions.20
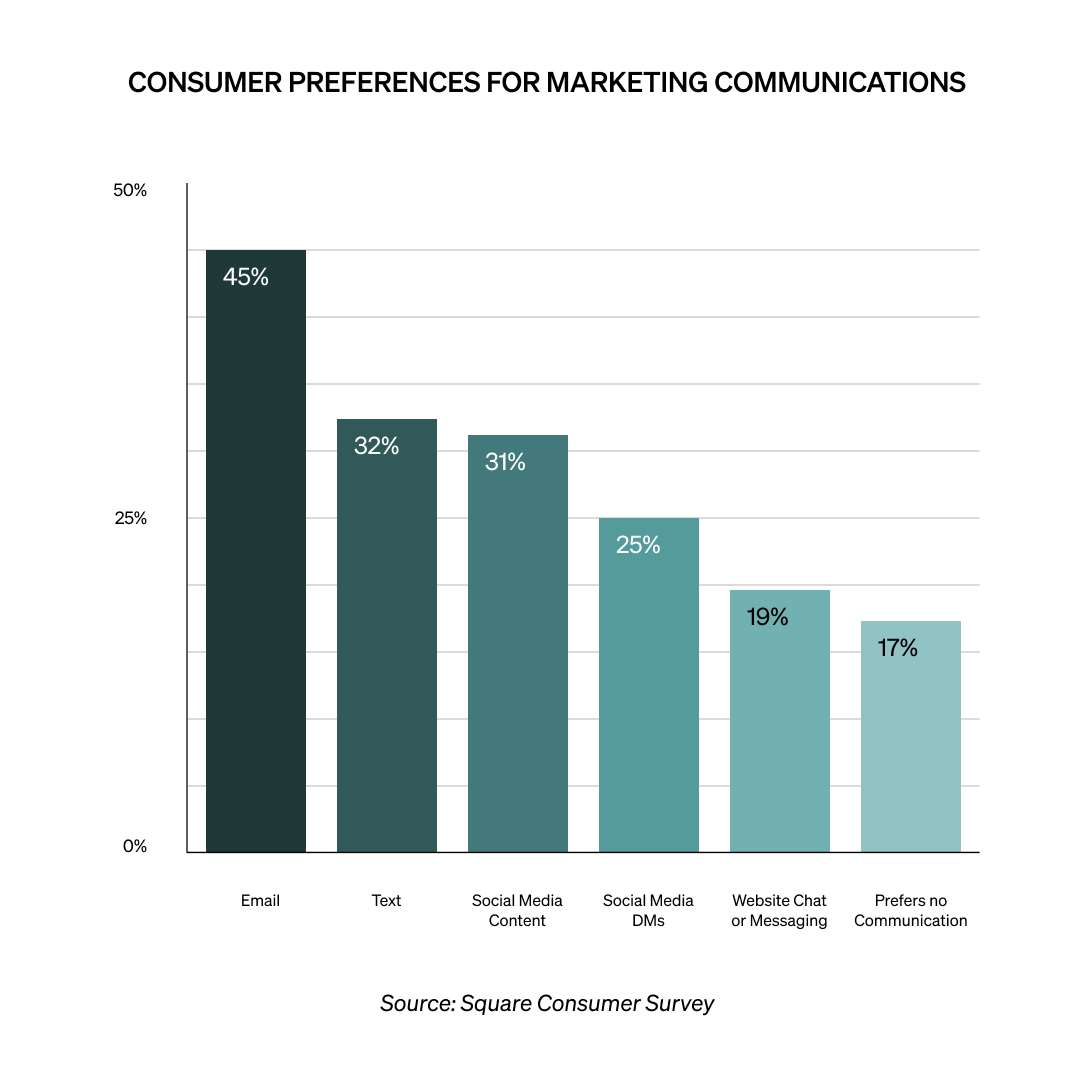
Customers want to hear from you (yes, really)
Communication is a growth lever when content is relevant. Despite spamming fears, 83% of consumers say they are open to messaging from local businesses.21 Email and text are the most-welcomed platforms — and they also offer the greatest opportunities for personalization. Among sellers nationally, text message marketing is becoming the most popular tool: of all marketing products, it saw the highest growth in uptake in 2025 of 8% nationally.22
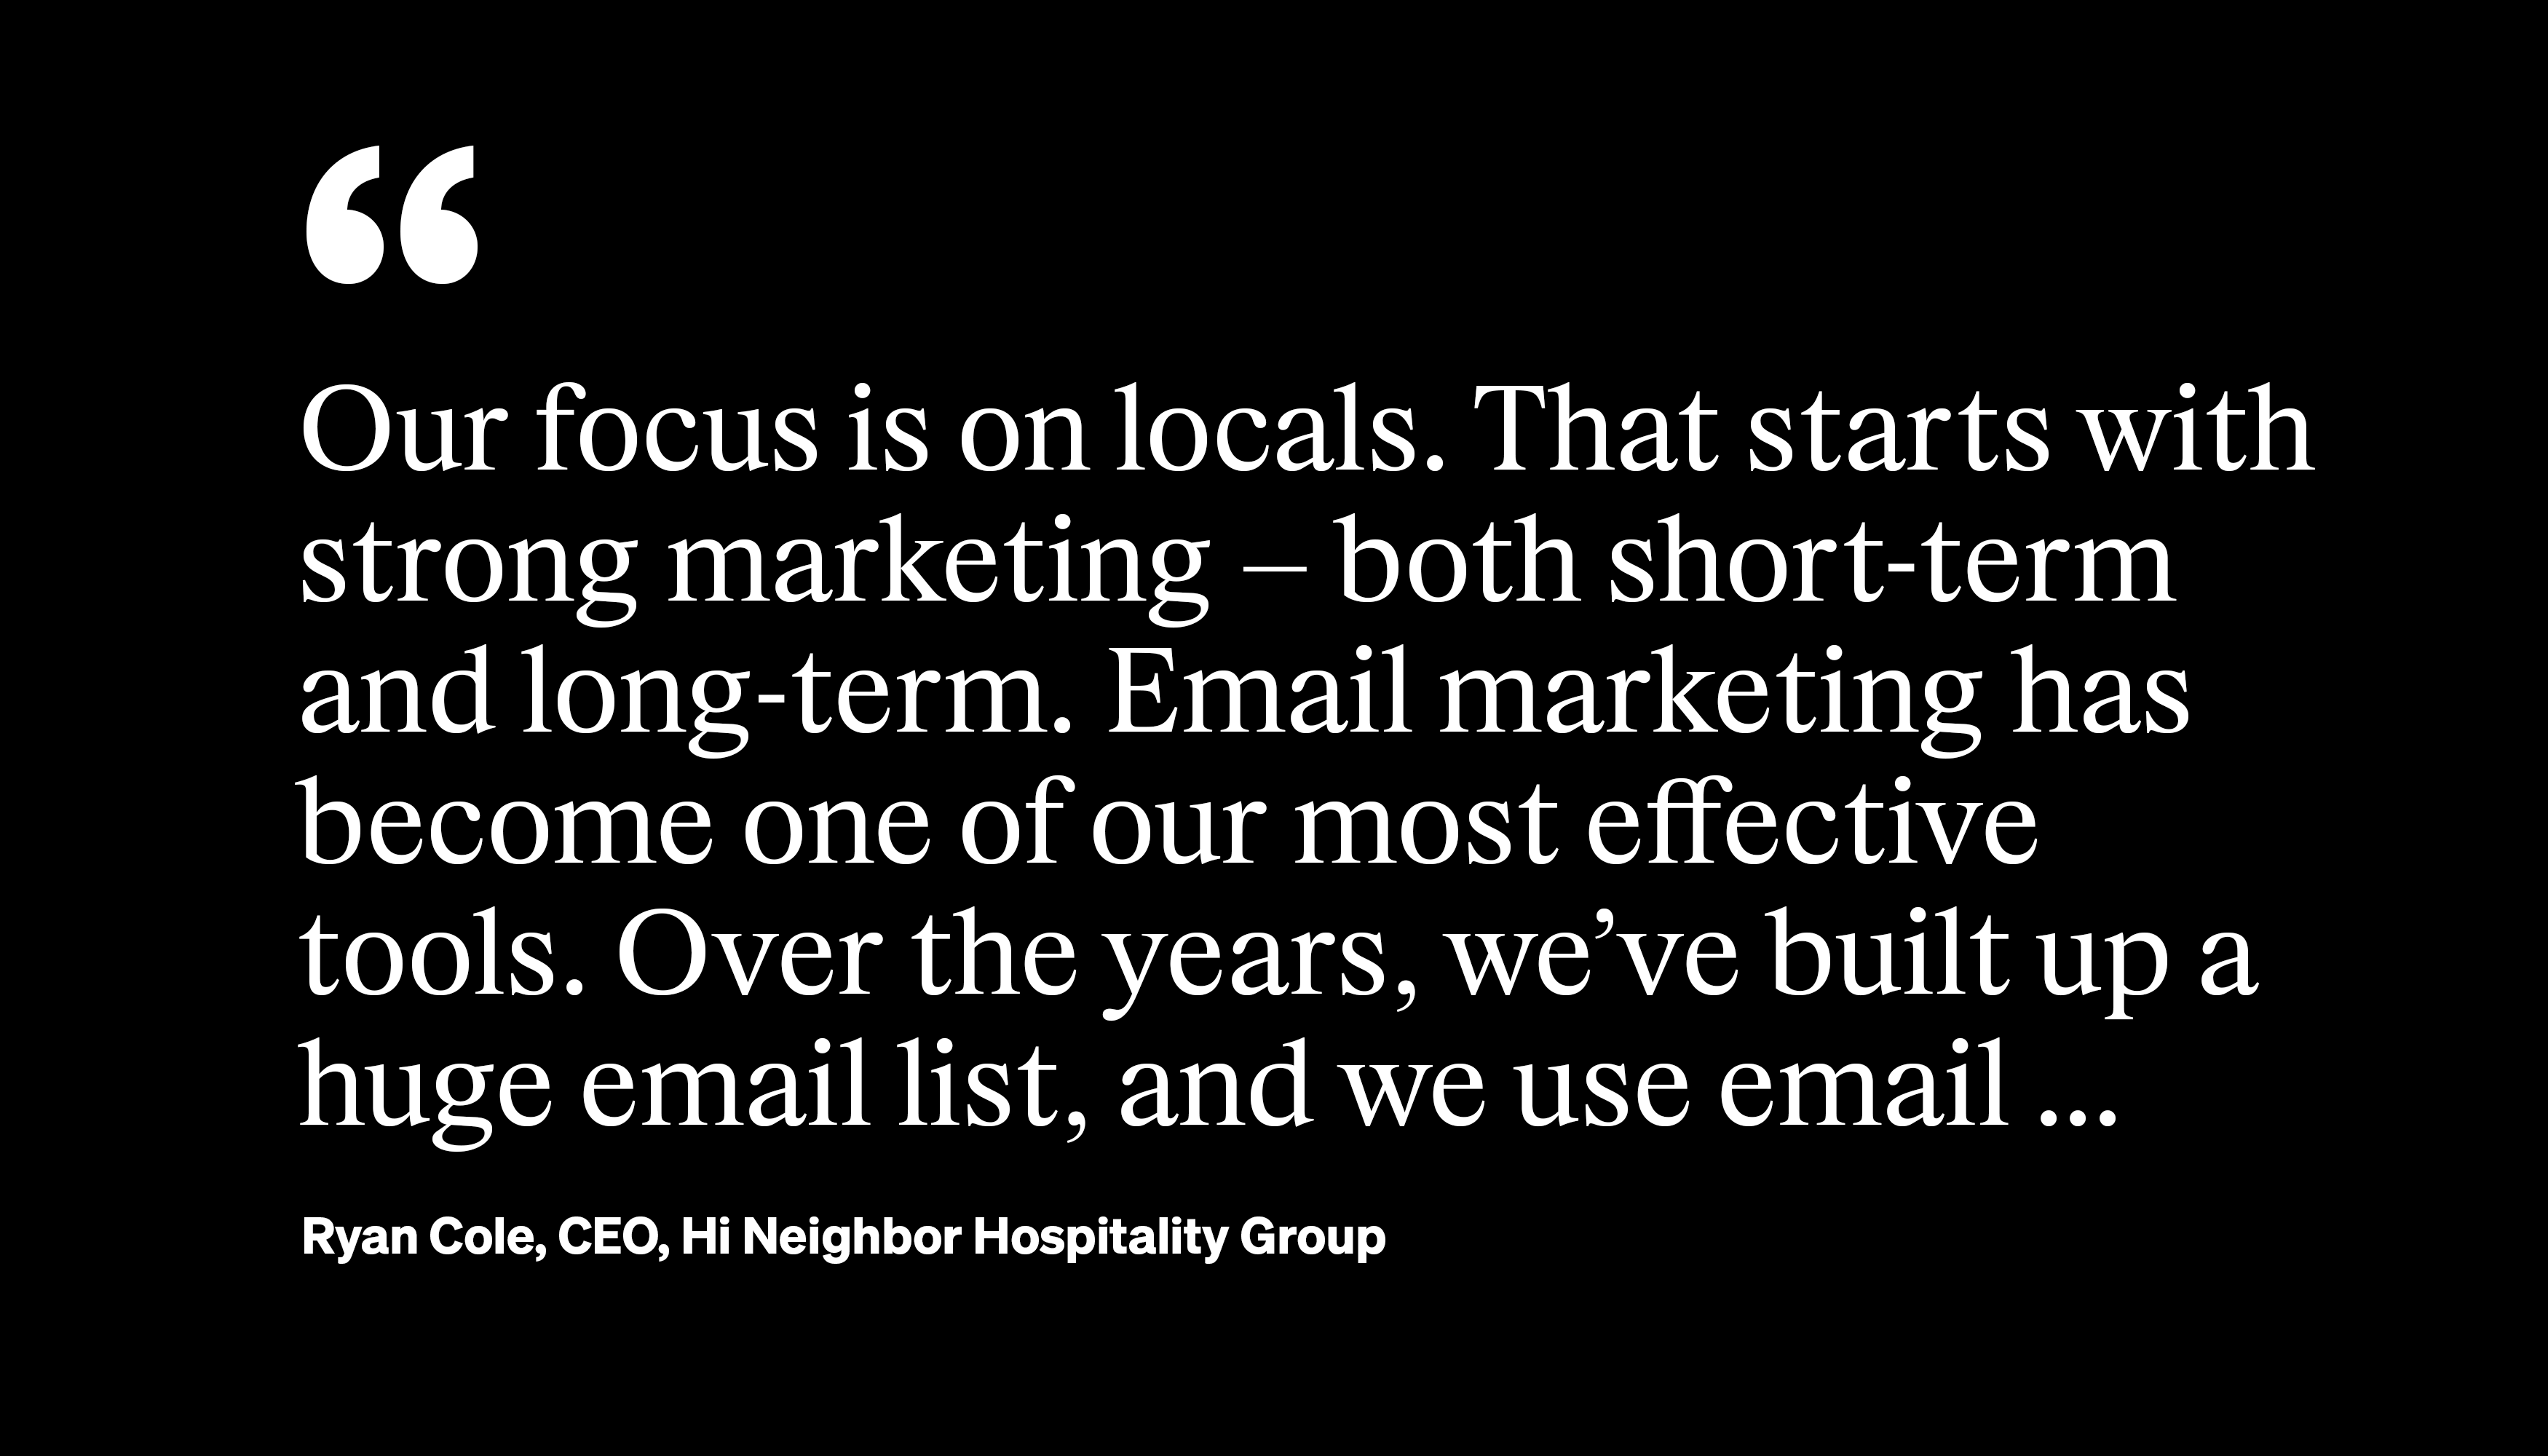
Communication tied to a loyalty program pays off. Nationally, local businesses see an average 5% lift in total transactions in the three months after launching a marketing or loyalty program when compared to the prior three months. For Ryan Cole, CEO of Hi Neighbor Hospitality Group in San Francisco, the business’ email newsletter keeps locals informed about upcoming events, new menus, and Michelin awards, which in turn keeps locals coming back.

11%
the lift in total transactions for Houston businesses after launching a marketing or loyalty program, 2X the national average.23
Marketing and loyalty tools facilitate an ongoing conversation with your customers, forging a deeper connection. The takeaway: Success in 2026 also depends on creating additional value, and clearly communicating it to your customers.


72% of consumers will tolerate price increases if paired with added value
The forecast for local commerce is defined by a more intentional consumer. Customers are increasingly prioritizing high-value experiences over purely transactional ones. Despite persistent economic pressures, the appetite for in-person local shopping and dining is growing. In-person transactions grew by 9% in 2025.24 Local businesses can seize this opportunity by adapting to shifting expectations and offering additional value that justifies spend.
The future spending forecast
Consumer intent shows a powerful commitment to local economies, even as customers scrutinize their budgets.

72%
of consumers are likely to continue shopping at a local business despite price increases if those increases are paired with added value, such as better products or exclusive offers25
Not all categories, or local economies, will experience the year the same way. Retail businesses are likely the most stable, with 78% of consumers saying they’ll maintain or increase their spending in that category for 2026.26
If forced to reduce spending, consumers will start by cutting back on food and beverage businesses. Twenty-seven percent of consumers say they are most likely to cut back on bars and breweries, and another 27% plan to cut back on full-service restaurants, highlighting a need for these businesses to focus on value-added loyalty.27
Square data shows regular customer revenue growth (7.67%) outpaced overall revenue growth (6.97%) nationally in 2025, a trend that remained consistent in the cities we analyzed.28 This suggests the regular will remain the primary driver of resilience in 2026. Together, these signals suggest that local businesses should treat loyalty, convenience, and network connectivity not as separate initiatives, but as a single, focused strategy.
The businesses that do this successfully will win in 2026 and beyond.
Turn your Neighborhood Network into your greatest advantage
Most local businesses gauge success by what is happening in their own books, but true resilience now requires looking outward at the neighborhood network.
Start by getting to know your customers through every sale. From what they order to when they return, Square point of sale brings real-time data and insights together in one place. This information is foundational to building memorable buying experiences, adding new offerings, and creating long-term relationships.
Don’t lose sight of your regulars who consistently show up during good and difficult seasons. With engagement tools like Square Marketing, you can stay connected and reward your loyal customers. Keep investing in the relationships that your business and thriving local economies are built on by frequently communicating your appreciation.
Leverage your community. Participating in local events and co-marketing strategies help boost sales for your business and the entire block. Consider connecting with your local coffee shop or a nearby restaurant. Across every city we studied, coffee shops and casual-dining restaurants shared the most regulars with nearby businesses.
For businesses looking to engage with the community in meaningful ways, Neal Idnani, who operates quick-service restaurant NaanStop in Atlanta suggests saying yes to the small things, which often lead to the next opportunity. To date, the business operates two to three pop-up fundraisers a week. “Once people saw us in their communities, they started saying, ‘We’ve got a 5K happening this weekend, can you come and do a presence?’ or ‘We’ve got an art gallery that’s holding a fundraiser for this other organization. Can you come over here?’” he said. These events have helped NaanStop turn first-time customers into loyal regulars. “We can track through Square Loyalty who orders at the pop-ups and then come to the store, which has been really great to see how many customers we’ve acquired through these fundraising efforts,” he said.
“Sellers need to know that the neighborhood is their competitive advantage,” Molnar said. “The businesses that will define the next era of local commerce aren’t just focused on their own four walls. They’re tapped into the rhythms of their community, deeply connected to their regulars, and showing up how it matters most: with ease, convenience, and in-person expertise.”
Footnotes
- Per Square network data
- Per Square network data
- Per Cash App data
- Consumer Survey Q3: In the past 12 months, how often have you made a purchase at the following types of local businesses in your neighborhood (defined by your zip code)? Restaurants: 24%; Retail stores: 25%
- Consumer Survey Q21: Nearly one in four U.S. consumers (24%) say they’ll shop or dine locally more often over the next 12 months.
- Correlation Per Square Network Data and Square Transaction Data
- Per Square network data
- Per Square transaction data
- Per Square transaction data
- Per Suare transaction data
- Per Square transaction data
- Per Square transaction data
- Aggregated R365 Customer Financial Data
- Consumer Survey Q22: If U.S. consumers make any change to how they’ll split their time shopping and dining at local restaurants over the next 12 months, it’s likely to be a move to more in-person experiences. Results: I plan to shop and dine more often in person: 33%, and I plan to shop and dine more often online (websites, apps, delivery platforms): 20%
- Consumer Survey Q16: Staff knowledge of products and services 56%
- Consumer Survey Q7: Restaurants and retailers were the most cited local businesses U.S. consumers frequent within their ZIP code or neighborhood. The faster the possibility of the transaction, the more frequently the business type seems to be visited (with the exception of full-service restaurants). Results: Retail stores 61%; Quick-service restaurants (e.g. counter service) 59%; Full-service restaurants (e.g. sit-down dining) 46%; Spas / wellness services 11%
- Per Square transaction data
- Consumer Survey Q13: High prices (55%) are easily the largest deterrent for consumers who are considering trying a new local business. Other concerns include: Inconvenient location 34%; Limited selection / offerings 31%; Lack of awareness / reviews 30%
- Per Square marketing data
- Per Square marketing data
- Aggregate number from survey Q10: How do you prefer local businesses to communicate with you? Text message / SMS 27%; Social media direct messages (e.g., Instagram DMs, Facebook Messenger) 24%, Website chat or messaging 16%
- Per Square marketing data
- Per Square marketing data
- Per Square transaction data
- Consumer Survey Q20: If a local business raised its prices in order to offer increased value (e.g., better service, better products, exclusive offers), how likely would you be to continue shopping there? Very likely 23%; Somewhat likely 49%
- Consumer Survey Q23: In the next 12 months, how do you expect your spending with local businesses in each of these categories to change? Retail: Spent more 17%; Spend about the same 61%
- Consumer Survey Q24: If you needed to reduce your spending, which two local business areas would you cut back on first? Bars and breweries 27%; Quick-service restaurants 18%
- Per Square transaction data
Disclaimers and data methodology
Disclaimer:
Prepaid debit cards issued by Sutton Bank, Member FDIC. Cash App Visa® Debit Flex Cards issued by Sutton Bank, Member FDIC, and The Bancorp Bank, N.A., pursuant to a license from Visa U.S.A. Inc. See terms and conditions for the Sutton prepaid card, Sutton debit flex card, and Bancorp debit flex card.
Data Methodology
Cash App Data
Cash App Card transactions Jun, Jul, Aug 2025, Internal Data.
Transaction Data
Square analyzed all buyer-seller interactions from Jan. 2019 through Dec. 2025. A buyer-seller relationship was considered to be “regular” if there were transactions between them on four or more distinct dates within a year; all other relationships were considered “transient.” Note that a single buyer can have both regular and transient relationships with different sellers. To calculate regular versus transient statistics, Square grouped transactions by regular and transient labels and computed summary metrics for each group, such as average spend and total transaction volume.
Network Data
Square isolated all “regular” buyer-seller relationships in 2025 based on the methodology described above. Square constructed city-level networks by drawing a connection between two sellers if they share at least one regular buyer. Most analyses are based on each network’s largest connected component – i.e., the largest subgraph where there exists a path between every possible pair of nodes.
Network visualizations represent the subgraph of a given city by postcode. For each city, we select the postcode that produces a subgraph containing 10-100 sellers and the greatest number of connections to demonstrate local connectivity and ensure visualization clarity.
Marketing Data
Square analyzed statistics based on enrollment in any of the following marketing products: Email Marketing, Text Message Marketing (US only), and Loyalty Programs. We compared two groups of sellers: enrolled in a marketing product versus not. To quantify the effects of activating a marketing product, Square analyzed all sellers whose earliest activation occurred on or after Jan 2023, and compared performance in the three months preceding activation versus the three months following activation, only including sellers with at least 75 days of transactions in each period.
Consumer Survey Methodology
Square and Studio by Informa TechTarget conducted an independent survey of 994 consumers in the United States between September 23 and December 30, 2025. Respondents were screened to include a representative sample of age groups (18 to 61+) and geographical locations within the United States.
Restaurant365 Data
Aggregated customer financial data from Restaurant365.
Download the
2026 Local Economy Report
Millions of companies use Square to take payments, manage staff, and conduct business in-store and online.
Download Now![]()