Table of contents
This article is only for educational purposes and does not constitute legal or financial advice. Make sure you consult a professional regarding your unique business needs.
According to global research and advisory firm IHL Group, cash costs on average 9.1% of cash received. There are a few things to consider when choosing payment options for your small business — from average transaction times to the cost of cash versus cashless alternatives.
In the U.S. market alone, from March 2020 to April 2020, sellers taking 95% or more in card payments have grown from 8% to 31%. This is according to millions of transactions by nearly 70,000 Square sellers across the U.S. accepting a minimum threshold of cash and card payments during this time period.

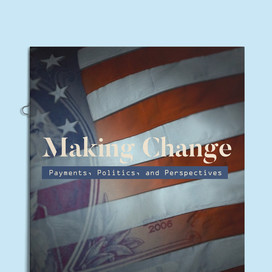
Making Change: Payments, Perspectives, and Politics
The cost of an average cash transaction
Many retailers focus on cash-only transactions due to concerns around high fees and costly contracts. According to the NFIB, small business owners associate costs from accepting credit cards in the top 50 problems they are faced with. The average cost of cash in a cash-only transaction can range from 4-15% over retail segments, but some of the top contributing factors include the opening and rebuilding of cash drawers, as well as back office and banking charges.
As sellers adapt to new and unexpected challenges during COVID-19, Square has seen a three percent increase in U.S. credit card usage for transactions in the $10-$20 range from March 1 to April 29, 2020.
Cost of An Average Transaction
| Cash | Cashless | |
|---|---|---|
| Average Cost | 9.1% of cash received | 3.5% + 15¢ or less per payment |
Learn more about Square’s Processing Fees.
Transaction time: cash vs. credit
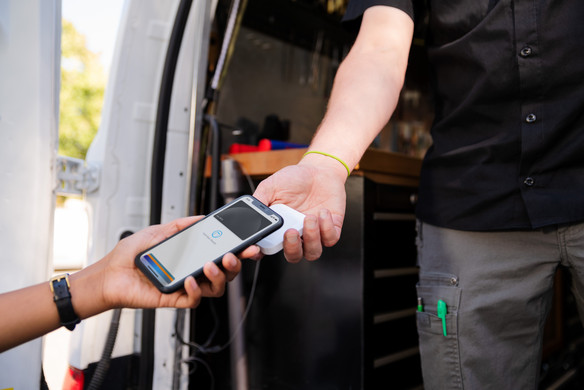
On average, processing EMV transactions take about 2 seconds, speeding up the time it takes for customers to not only make purchases but to move through the line. As states slowly reopen during COVID-19, business owners are taking measures to mitigate any sanitation risks that come with cash and credit transactions by employing touch-free and card-not-present transaction methods.
In 2017, payments made using cards overtook cash globally. One of the largest slowdowns in cash versus credit card transactions is counting cash and reconciling books afterwards. On average, of small businesses surveyed, it took an estimated 542 hours to process $100,000 in non-digital payments compared to the 189 hours it took to process the same digital payments-roughly three times the amount of time.
The physical costs of cash
In 2018, nearly $38.5 billion dollars were spent on closing out drawers. Here’s how this breaks down:
Cost of Cash Percentage by Function
| Physical Cost | Percentage | Details |
|---|---|---|
| Close Drawer | 40.1% | Time for cashiers/managers to count and reconcile the drawer with POS or cash register tools |
| Start/Rebuild Drawer | 16.3% | Opening drawer from initial deposit to rebuild for next cashier |
| Prepare/Coordinate Deposits | 7.7% | Costs associated with preparing or coordinating deposits |
| Pickups | 7.6% | Pickups during a shift for too much cash in the drawer or bills that are large denominations |
| Change Orders | 7.5% | Cost associated with a cashier requiring change throughout the shift |
| CIT/Deposit Costs | 6.9% | Costs of Cash In Transit (armored trucks) or cost of employees to go to the bank to make the deposit |
| Cash Shrink | 6.6% | Cost of theft, fraud or other cash loss activities. Cash that disappears in the process |
| Bank Charges | 4.3% | Statement fees, reconciliation, cash value fees, and change orders |
| Audits/Discrepancies | 2.9% | Costs of redoing counts, auditing tills, and time associated with recounts for discrepancies |
As the COVID-19 pandemic has swept the world, Square has been keeping an eye on seller payment trends around cash transactions, credit transactions and safety-first approaches to business.
*IHL is [was formerly] an advisor to Square.
![]()


