

Important methodology notes:
matcha beverages are any items at bakery_pastry_shops or coffee_tea_cafes that match any of: ‘matcha’, ‘%matcha%latte%’,’iced % matcha’, ‘ice matcha’, ‘iced matcha’the matching is case insensitive & a “%”is a wildcard — i.e., it matches anything. that means we’re picking up on things like ‘iced vanilla matcha’, ‘iced strawberry matcha’, etc.
2025 Summary Stats
Entire UK
In June and July of 2025, across the entire UK, a matcha beverage was sold 1,606,627 times by 2,106 sellers for an average of $4.41, bringing in a total GPV of $7,092,988.
By Region
In June and July of 2025, in Birmingham, a matcha beverage was sold 71,314 times by 166 sellers for an average of $4.36, bringing in a total GPV of $310,787.
In June and July of 2025, in Brighton, a matcha beverage was sold 12,853 times by 51 sellers for an average of $4.67, bringing in a total GPV of $60,149.
In June and July of 2025, in Bristol, a matcha beverage was sold 10,404 times by 33 sellers for an average of $4.47, bringing in a total GPV of $46,572.
In June and July of 2025, in Cardiff, a matcha beverage was sold 5,084 times by 32 sellers for an average of $4.45, bringing in a total GPV of $22,663.
In June and July of 2025, in Liverpool, a matcha beverage was sold 25,835 times by 118 sellers for an average of $4.4, bringing in a total GPV of $113,657.
In June and July of 2025, in London, a matcha beverage was sold 1,224,816 times by 982 sellers for an average of $4.42, bringing in a total GPV of $5,414,546.
In June and July of 2025, in Manchester, a matcha beverage was sold 82,152 times by 79 sellers for an average of $4.41, bringing in a total GPV of $362,101.
In June and July of 2025, in York, a matcha beverage was sold 1,492 times by 12 sellers for an average of $3.9, bringing in a total GPV of $5,822.
Top Matcha Sellers in 2025
Sellers that made >$25k in matcha sales throughout June/July 2025 (combining data from all locations):
- Blank Street UK Limited: 838,856 sales, $3,604,084
- Blank Street :61,792 sales, $263,145
- Blank Street Coffee: 44,879 sales, $191,696
- Matchado Ltd: 30,519 sales, $143,216
- 80 Kingsway: 20,491 sales, $87,263
- How Matcha: 13,360 sales, $61,110
- BLK CAB (coffee & people): 8,572 sales, $53,504
- Frothee: 9,194 sales, $45,655
- Omotesando Koffee: 7,492 sales, $40,562
- Society Cafe LTD:7,345 sales, $33,300
- Noxy Brothers: 5,481 sales, $25,664
- SONTAG: 5,804 sales, $25,554
2025 Repeat Customers
Important methodology note: We can only identify a customer by their card; if 1 customers uses 5 different cards (for example), they will be counted as 5 different customers.
In June & July of 2025:
- 865,926 customers bought at least 1 matcha beverage.
- 62.4% of customers bought only 1 matcha beverage; 37.6% bought more than 1.
- The average number of matcha beverages per customer was 1.86.
- The average matcha GPV per customer was $8.19.
- The average number of days buying a matcha drink per customer was 1.59.
Among customers that bought >1 matcha beverage , the average number of matcha purchases was 3.34, the average GPV was $14.74, and the average number of days buying a matcha drink was 2.62.
YoY Changes, 2020-2025
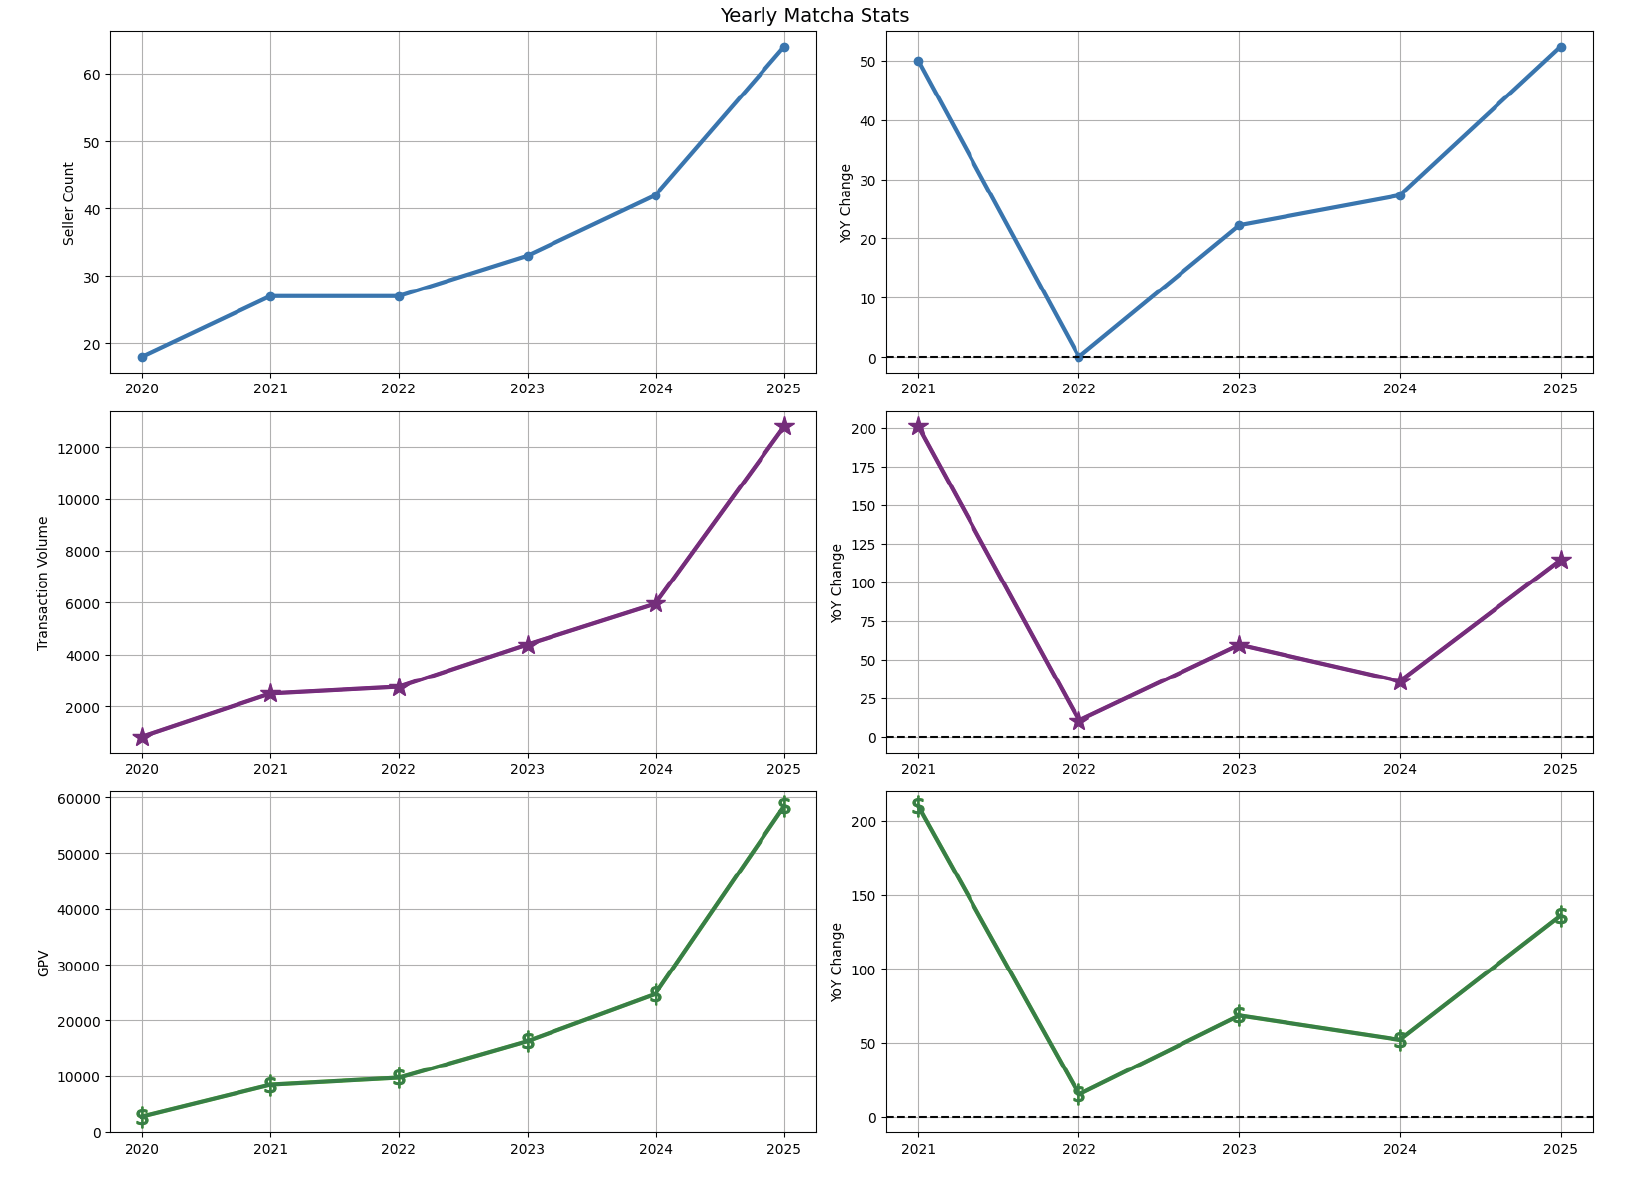
Important methodology notes:
- For each year, we only look at data from June & July – not the entire year.
- This is a same store analysis — we only consider sellers who were active (≥5 transactions) in June & July of each year (2020 through 2025).
- When you see the seller count going up, that means more of these active sellers started selling matcha — it does not mean that new matcha sellers started cropping up.
Entire UK
Comparing matcha to other espresso drinks: in most years, matcha transaction volume growth outpaced all the other observed drinks. Comparatively, matcha had the highest growth (+114.5%) in 2025.
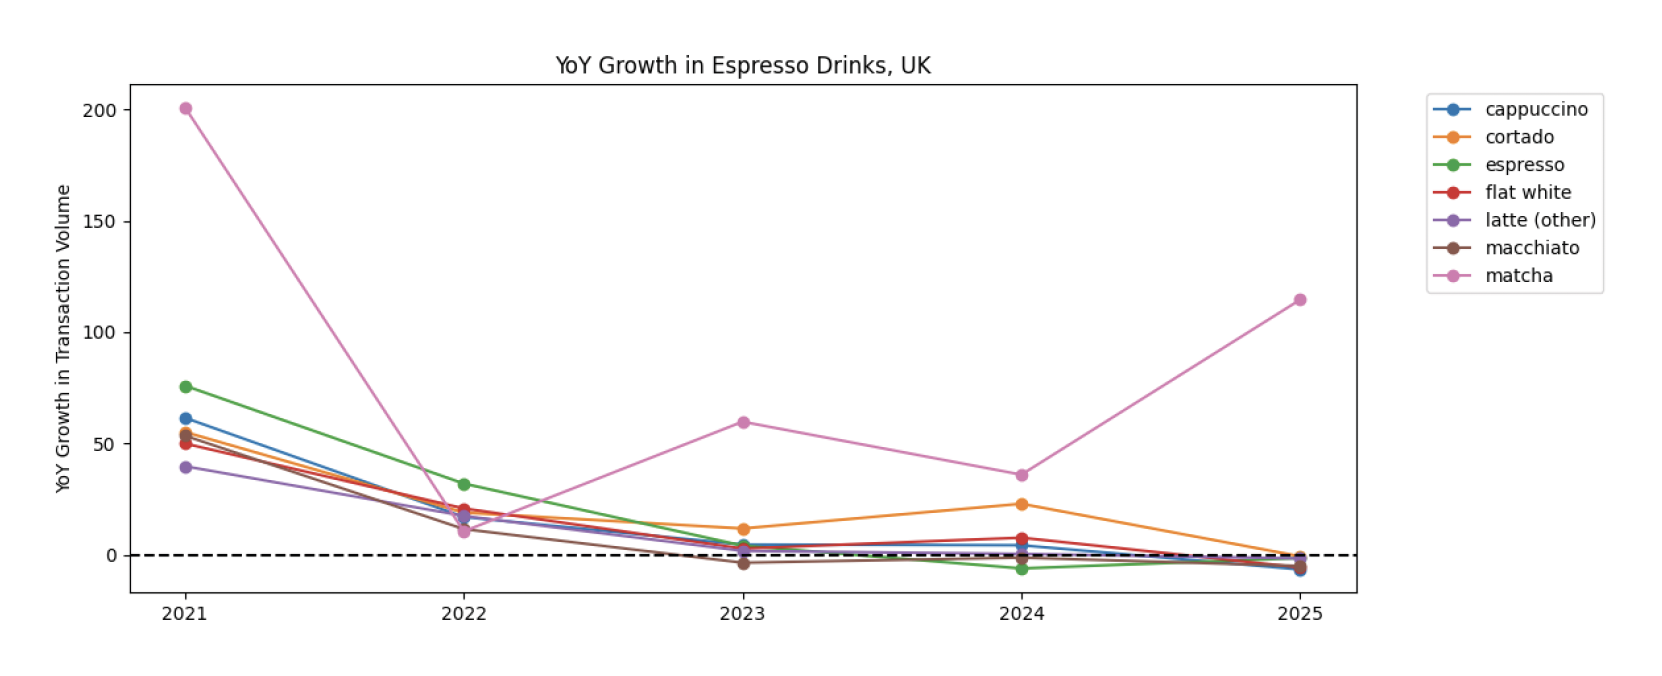
In each year since 2020, matcha has seen increased sales, increased GPV, and increased participating sellers. The left panel shows raw counts; the right panel shows YoY changes. In 2025, participating sellers were up 52.4%, transaction volume was up 114.5%, and GPV was up 135.9% YoY.
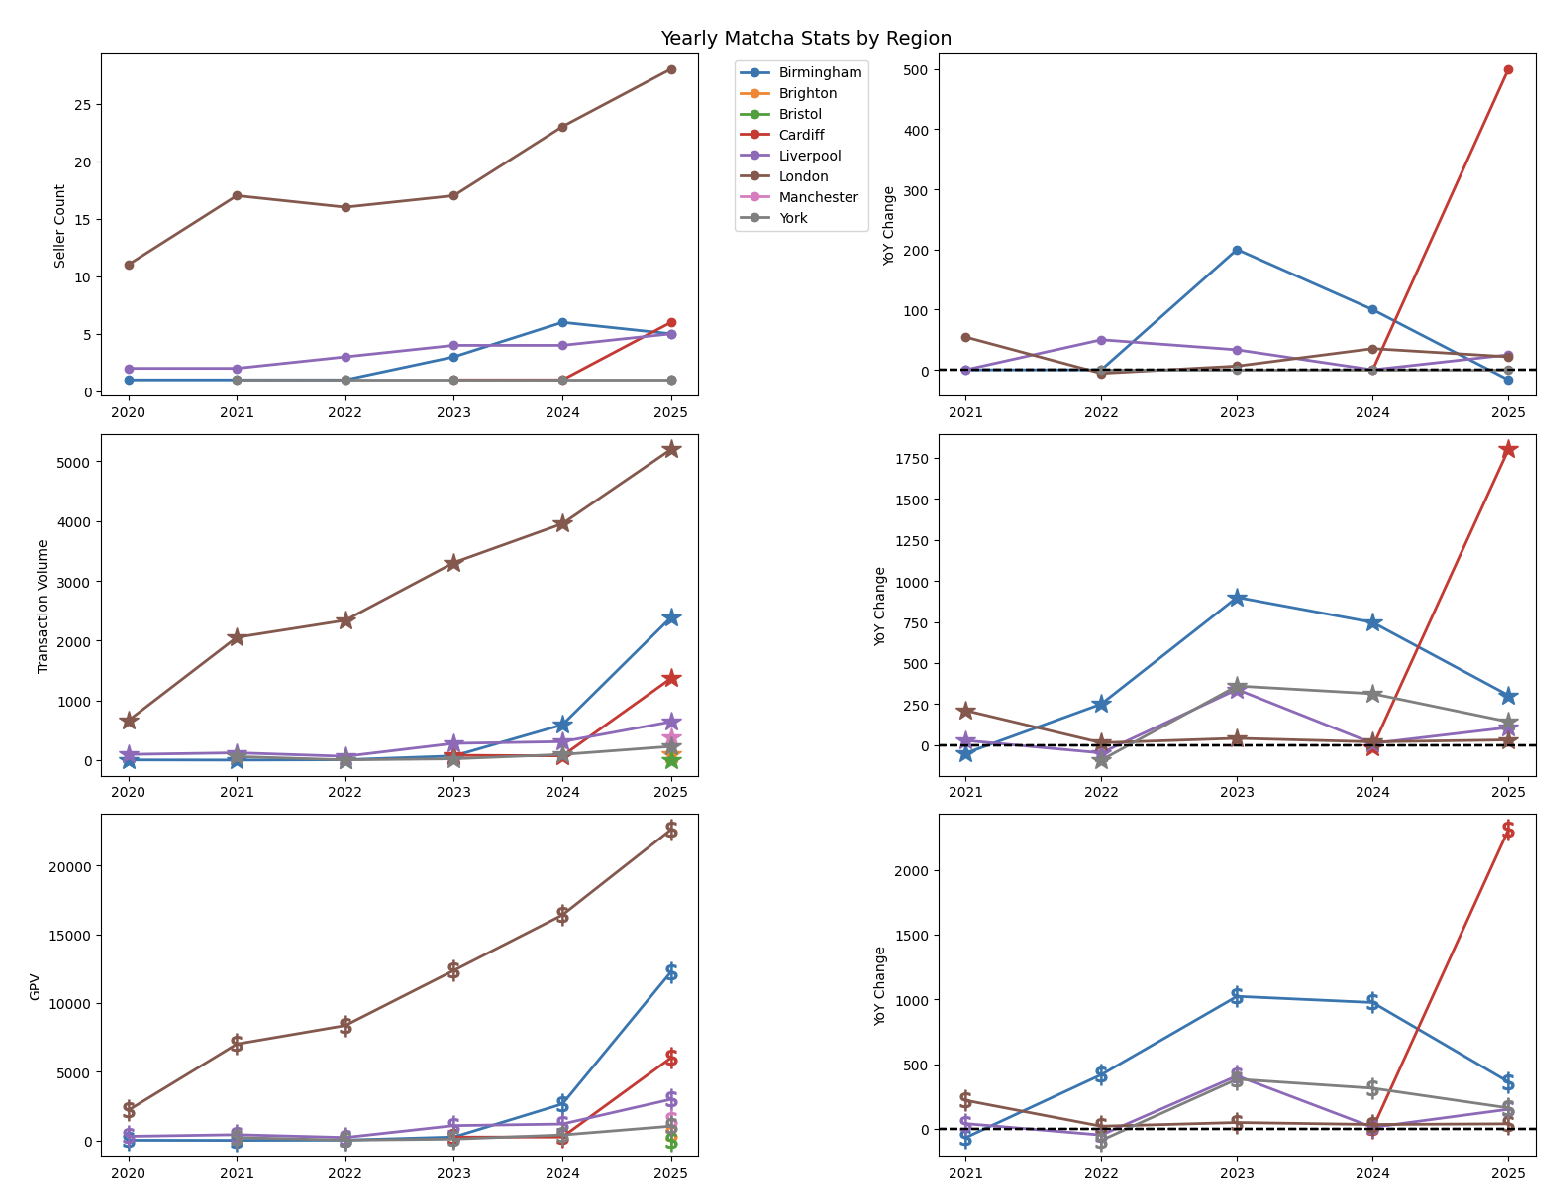
By Region
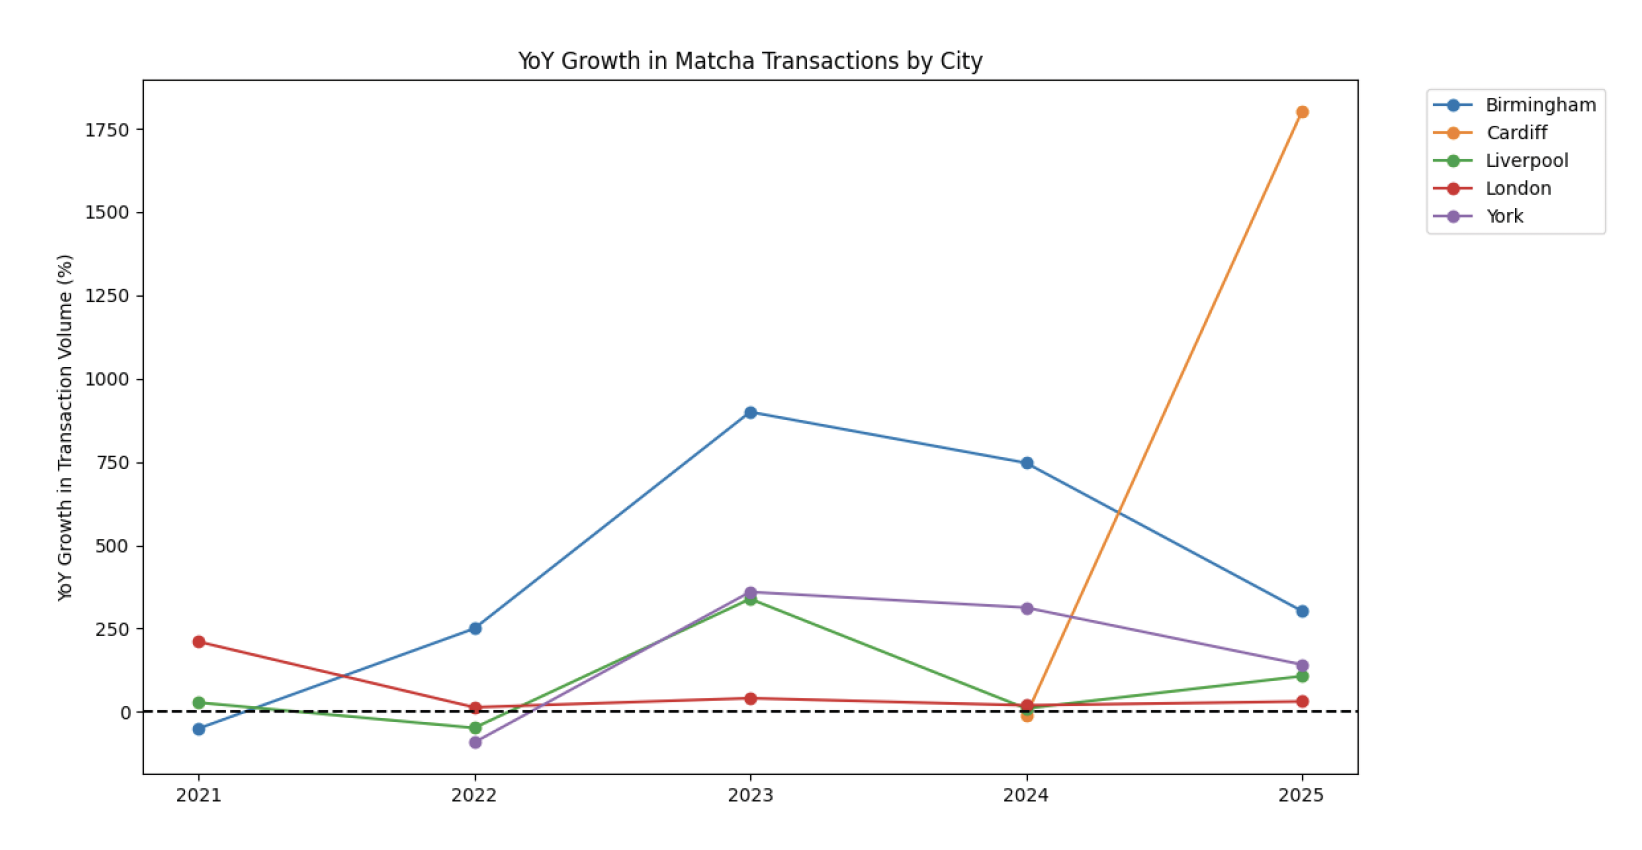
Brighton, Bristol, and Manchester did not have sellers that were active since 2020 that sold matcha prior to 2025; therefore, these cities do not appear in the top plot or the right panel of the plots below.
For the rest of the cities, matcha transaction volume saw positive growth between 2024 and 2025.
Note that all cities have ≤6 sellers at their peak, except for London, meaning this analysis has very small sample sizes!
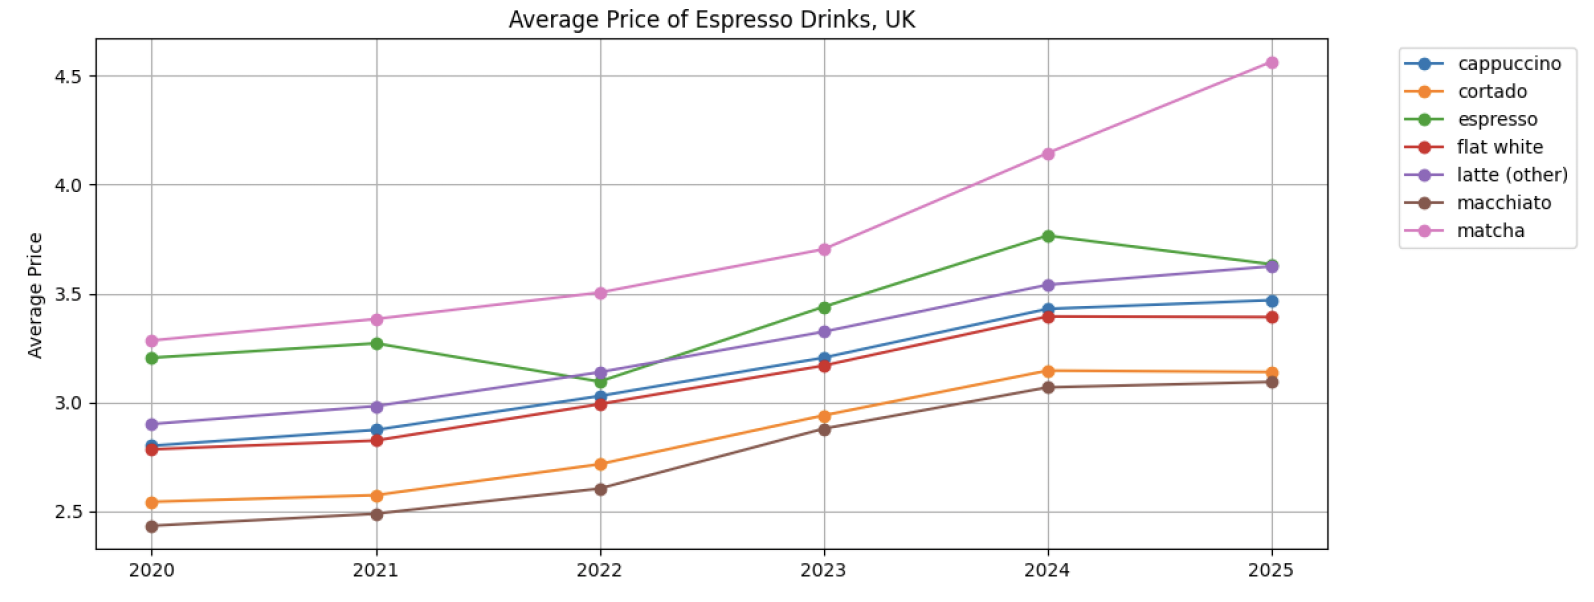
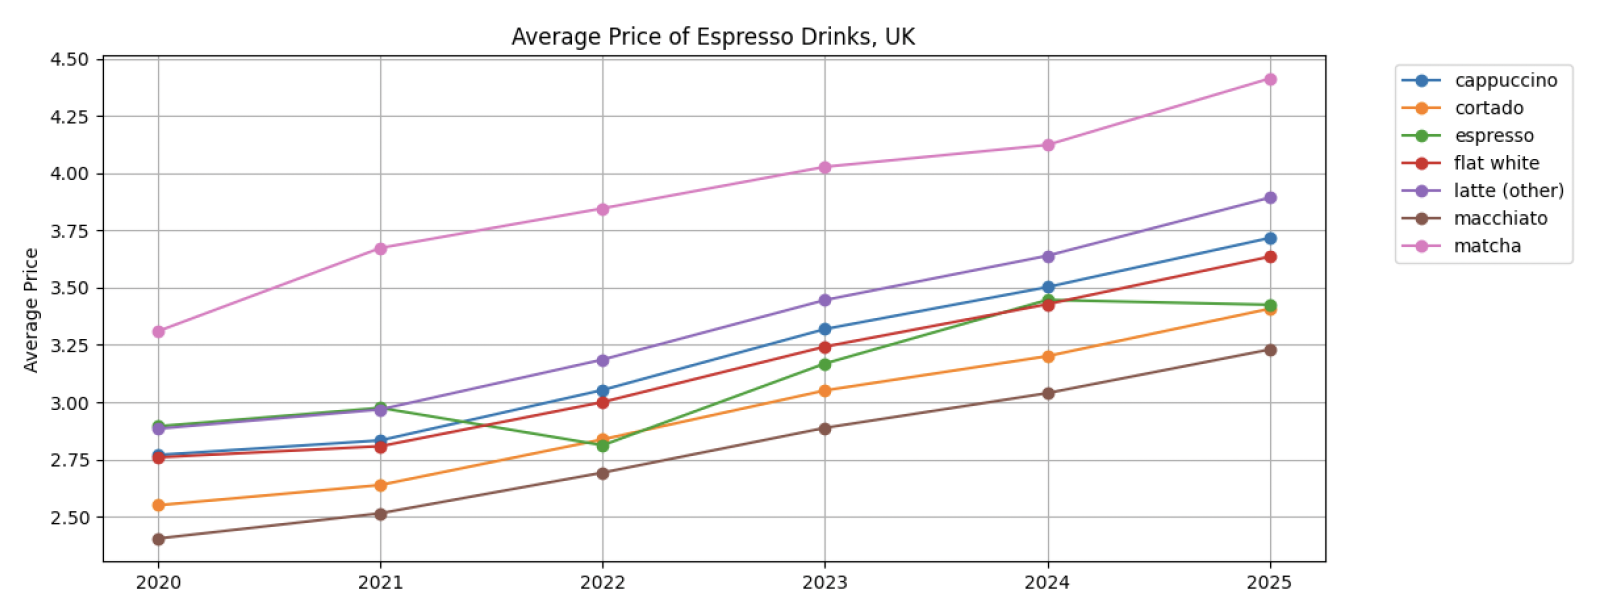
Yearly Prices, 2020-2025
Same store
- Only consider sellers who were active (≥5 transactions) in June & July of each year (2020 through 2025)—therefore, this tracks how the same sellers have changed their pricing.
Not Same Store
- Consider all sellers all the time — therefore, this tracks the general state of matcha prices per year
Yearly Matcha Shares, 2020-2025
Important methodology notes:
- For each year, we only look at data from June & July – not the entire year
- The “Matcha GPV Share”is the share of GPV earned from matcha sales out of all sales at coffee_tea_cafes and bakery_pastry_shops that match any of: ‘%matcha%’,’%latte%’,’%espresso%’,’%cappuccino%’,’%flat white%’,’%macchiato%’,’%cortado%’
Same store
- Only consider sellers who were active (≥5 transactions) in June & July of each year (2020 through 2025)
- The regional same store analyses have very small sample sizes, with the exception of London
Entire UK

2025 Market Share: 3.85%
By Region
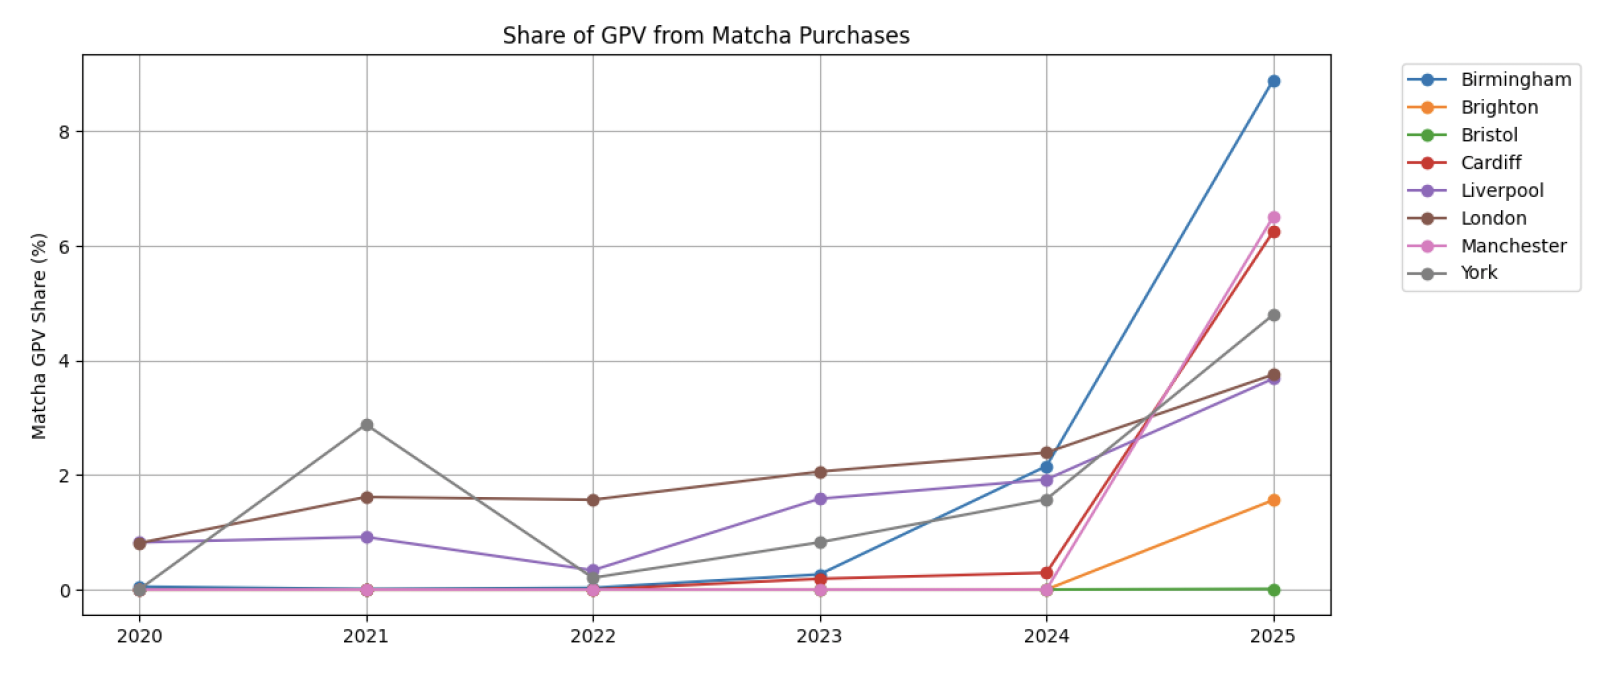
2025 shares:
Birmingham 8.9%
Brighton 1.6%
Bristol 0.01%
Cardiff 6.3%
Liverpool 3.7%
London 3.8%
Manchester 6.5%
York 4.8%
Not same store
- Consider all sellers
Entire UK
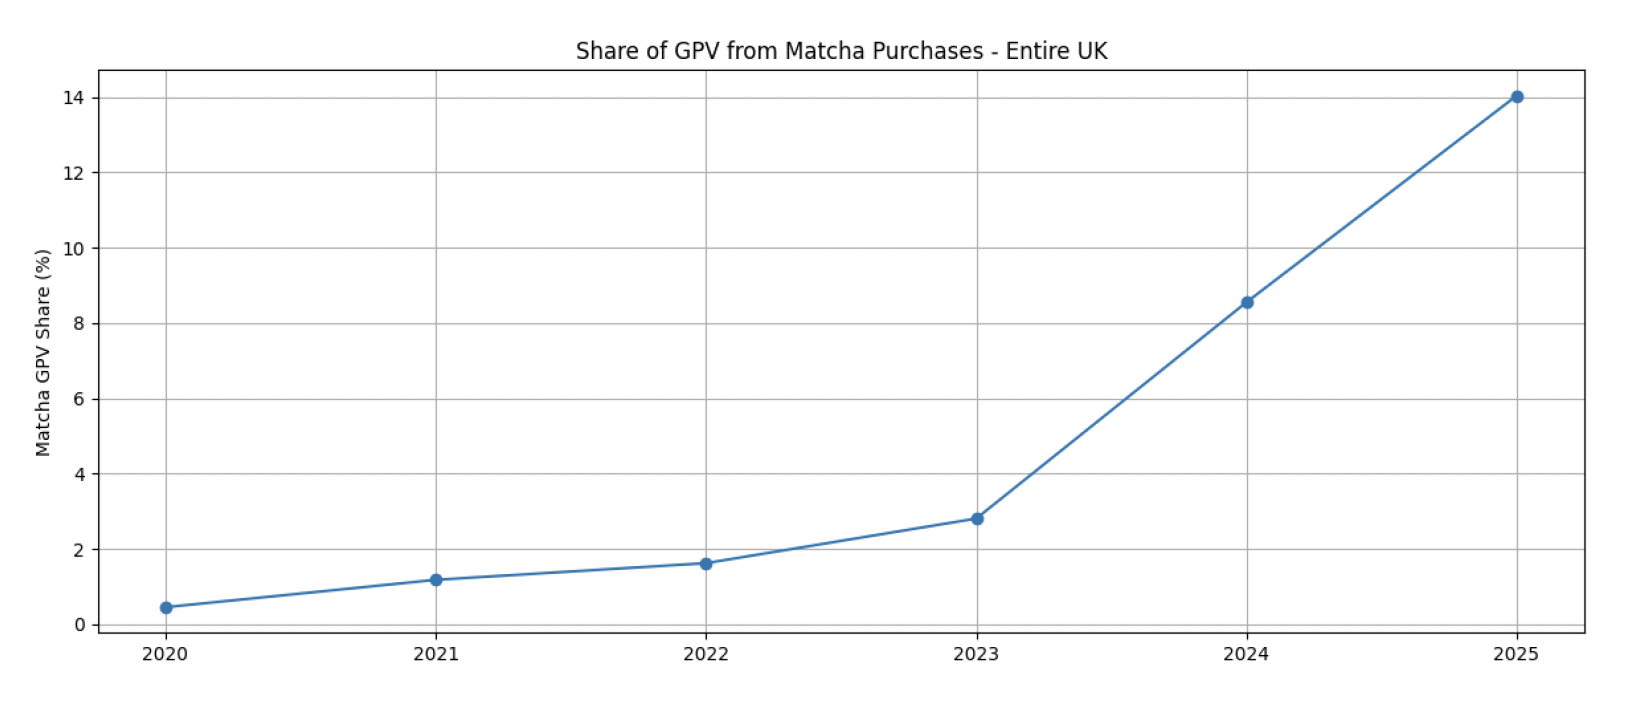
2025 share: 14.04%
By Region
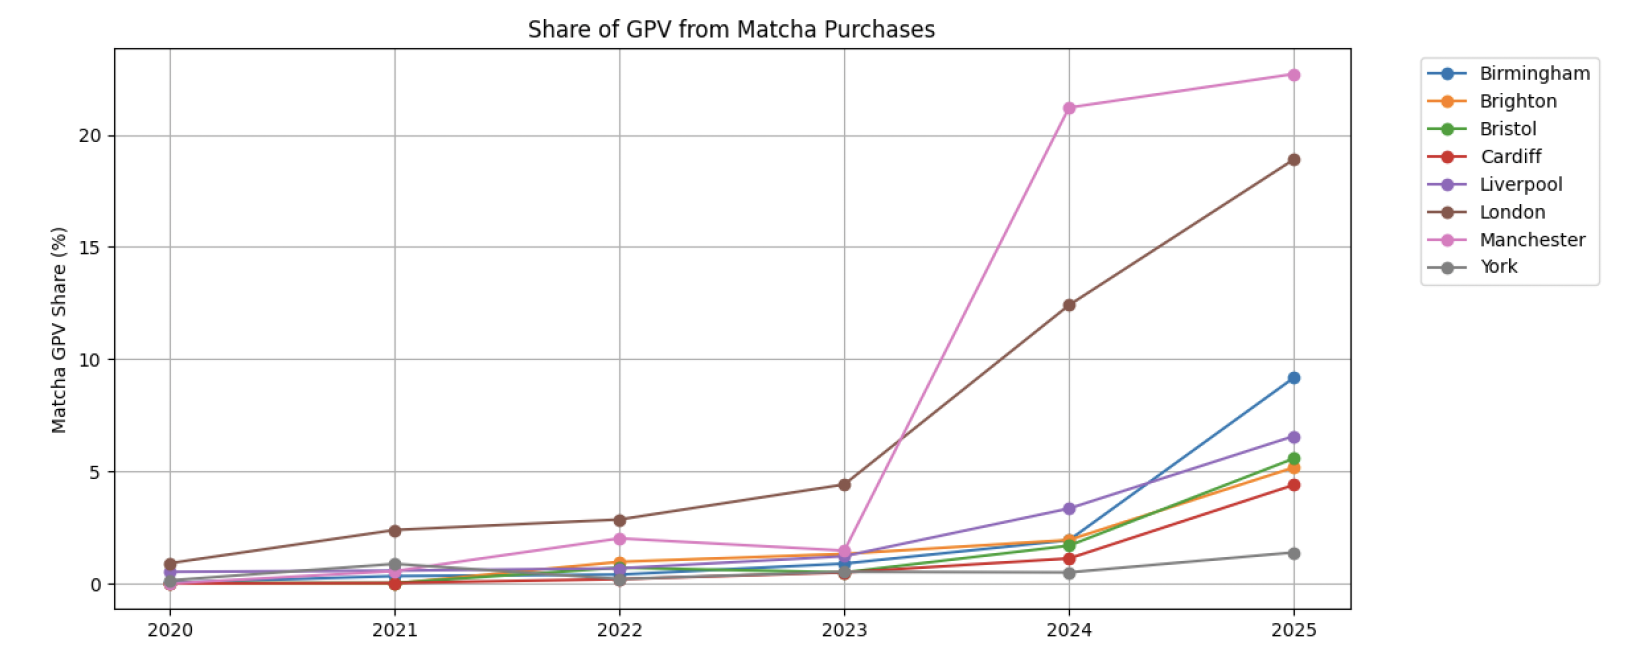
2025 shares:
Birmingham 9.2%
Brighton 5.2%
Bristol 5.6%
Cardiff 4.4%
Liverpool 6.6%
London 18.9%
Manchester 22.7%
York 1.39%
![]()


