We’re celebrating the first anniversary of Square Point of Sale in Australia, and in honour of this momentous occasion we have a gift for you: The Square Australian Coffee Report. It’s an analysis of 12 months of coffee sales data from Square sellers across the country.
We’ve crunched the numbers on the millions of coffee cups sold to determine the most popular espresso drinks in every state and territory, as well as the average price we’re paying for our favourite coffees. We’ve also done a deep dive on the espresso capital of Australia — Melbourne — and looked at different suburbs around the city to see what customers are paying for their lattes.
Want the latest stats? Read our 2018 Coffee Report here.
The Square Australian Coffee Report shows us that customer demand and price sensitivity can vary dramatically by state, as seen by latte drinkers in Queensland who can pay up to six percent more than those in Victoria. We also found that coffee shop owners in Sydney start their day early to meet the city’s peak coffee sales time at 8.00 a.m. By comparison, peak coffee sales in Melbourne don’t occur until 9.30 a.m. As Felipe from specialty coffee bar Sensory Lab in Bondi tells us, “I think there is one simple explanation for this: Sydney traffic!”
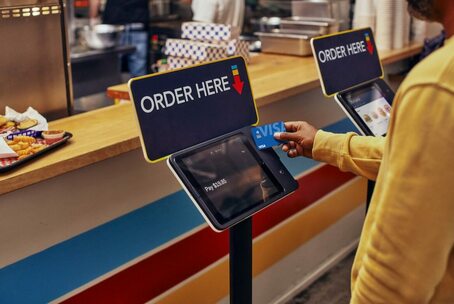
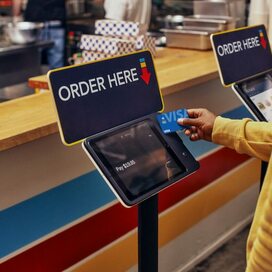
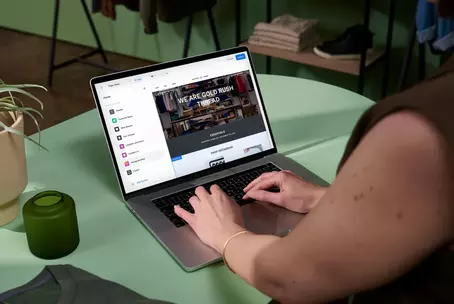
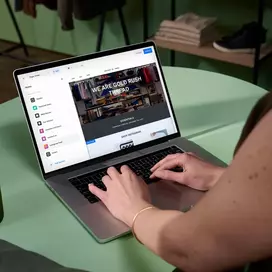
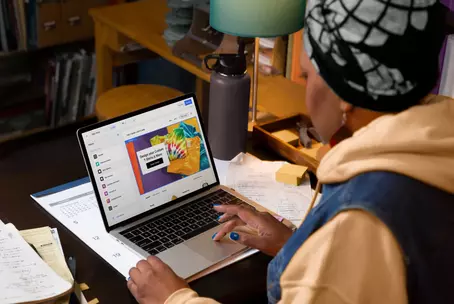
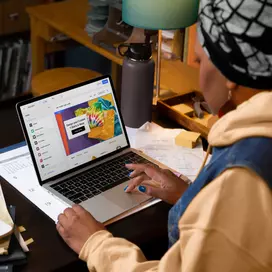
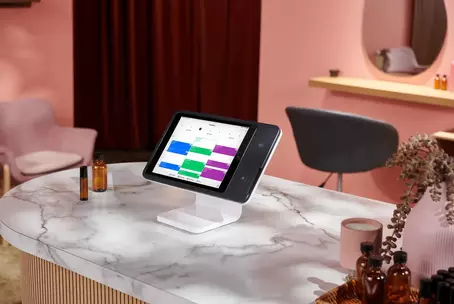
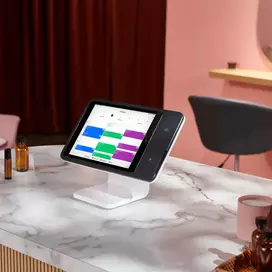
Would you believe that all this data was pulled together using Square Dashboard, the free and powerful reporting toolkit available to every Square seller? Cafe and coffee bar owners from across Australia use Square to power their businesses and have access to this kind of data about their own shops right at their fingertips. It’s easy to find out which beans are selling best, which hours are the busiest, and where the opportunities to increase sales might be.
Data insights can help you make smarter, more informed decisions about how to run your business. Dan at Melbourne-based coffee bar Stand Up Cafe uses Dashboard to help make day-to-day decisions: “I use it to see when I’m busiest, which is a useful feature for me at Stand Up Café as I’ll be looking to employ someone part time in the near future.”
Getting started is simple. Download the Square Point of Sale app, and start recording your sales to get access to all that precious data. And don’t forget to grab a latte.
![]()