
Traditionally, detailed reporting and analytics about a business’s performance were expensive and hard to set up — not a great option for small business owners. Nowadays, Square Analytics gives our local Square Sellers access to sales trends, helpful charts and personalised data that helps them run smarter.
Here’s some simple ways that you can use Square Analytics in your small business.
Keep across what’s selling and what’s not
You may think that soy milk is the new trend in specialty coffee, but it could be that your customers are already on to almond milk (the next hot trend). With Square Analytics, you can see real-time charts to show you exactly which item modifiers are most popular, what time of day they’re requested and much more. Use this insight to ensure you’re pricing your add-ons correctly, and that you’ve always got plenty in stock.
Work the hours that mean the most
We hear amazing stories from around the world about our sellers using Square Analytics to run their business better. One such story from the U.S. is Pam Turkin, owner of Just Baked cupcake shops, who determines her business hours based on this data: “When I opened Just Baked in Detroit, I was guessing when customers would stop in for a cupcake. Square Analytics showed that this location’s busiest hour was actually between 4:00 p.m. and 5:00 p.m. We would have closed at 4:00 p.m. and missed out on sales if not for Square Analytics’ hour-by-hour trends.”
Time your holiday
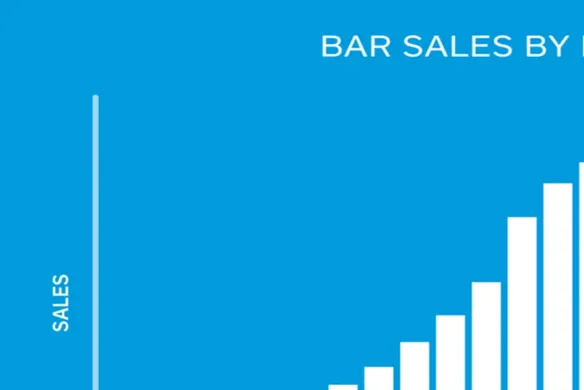
Taking a break is important to prevent burnout, but knowing the right time to go is important to minimise the impact on your business (and let you get away without worry). Use the Sales Trends report from Square Analytics to help you compare hourly, daily, weekly and yearly sales and identify trends. Are the numbers telling you November is likely to be quiet? Use this as a chance to book that trip.
Get real-time insights into your business performance
There’s nothing more exciting than watching your business grow with every new sale. Visit your Square Dashboard and see sales charts and widgets update in real time with each transaction. Because it’s cloud-based, you can access it from any device with a web browser, which means no more calls to check up on the store and no more sorting through spreadsheets and creating pivot tables to get an idea of how you’re running. Trust us — if you’ve never used a pivot table before, you’re not missing anything exciting.
Square Analytics is a free, full suite of reporting and analytics tools that comes with Square Point of Sale.
Related Articles
- Five Tips to Help You Make the Most of Square Point of Sale
- Run Your Small Business Smarter with Sales Data
- Why You Need a Point-of-Sale System for Your Retail Business
![]()


