Table of contents
Serving the perfect cup of coffee is big business in Australia, and there is plenty of competition to prove it. Whether your favourite morning beverage is served at the local neighbourhood cafe, in a converted warehouse, by one of the corporate coffee giants, or grabbed from the growing number of drive-through vendors, Australia has one of the most saturated coffee markets on the globe.
We’re big fans of the espresso here at Square, that’s why we’re giving you a sneak peek into the $8 billion industry that none of us could live without with our third annual Square Australian Coffee Report. It’s an analysis of the millions of cups of coffee sold at thousands of Square powered cafes and coffee bars across the country to help you learn more about how Australians consumed their favourite coffee beverages in 2018.
Want the latest stats? Read our 2019 Coffee Report Here.
Coffee pricing in Australia
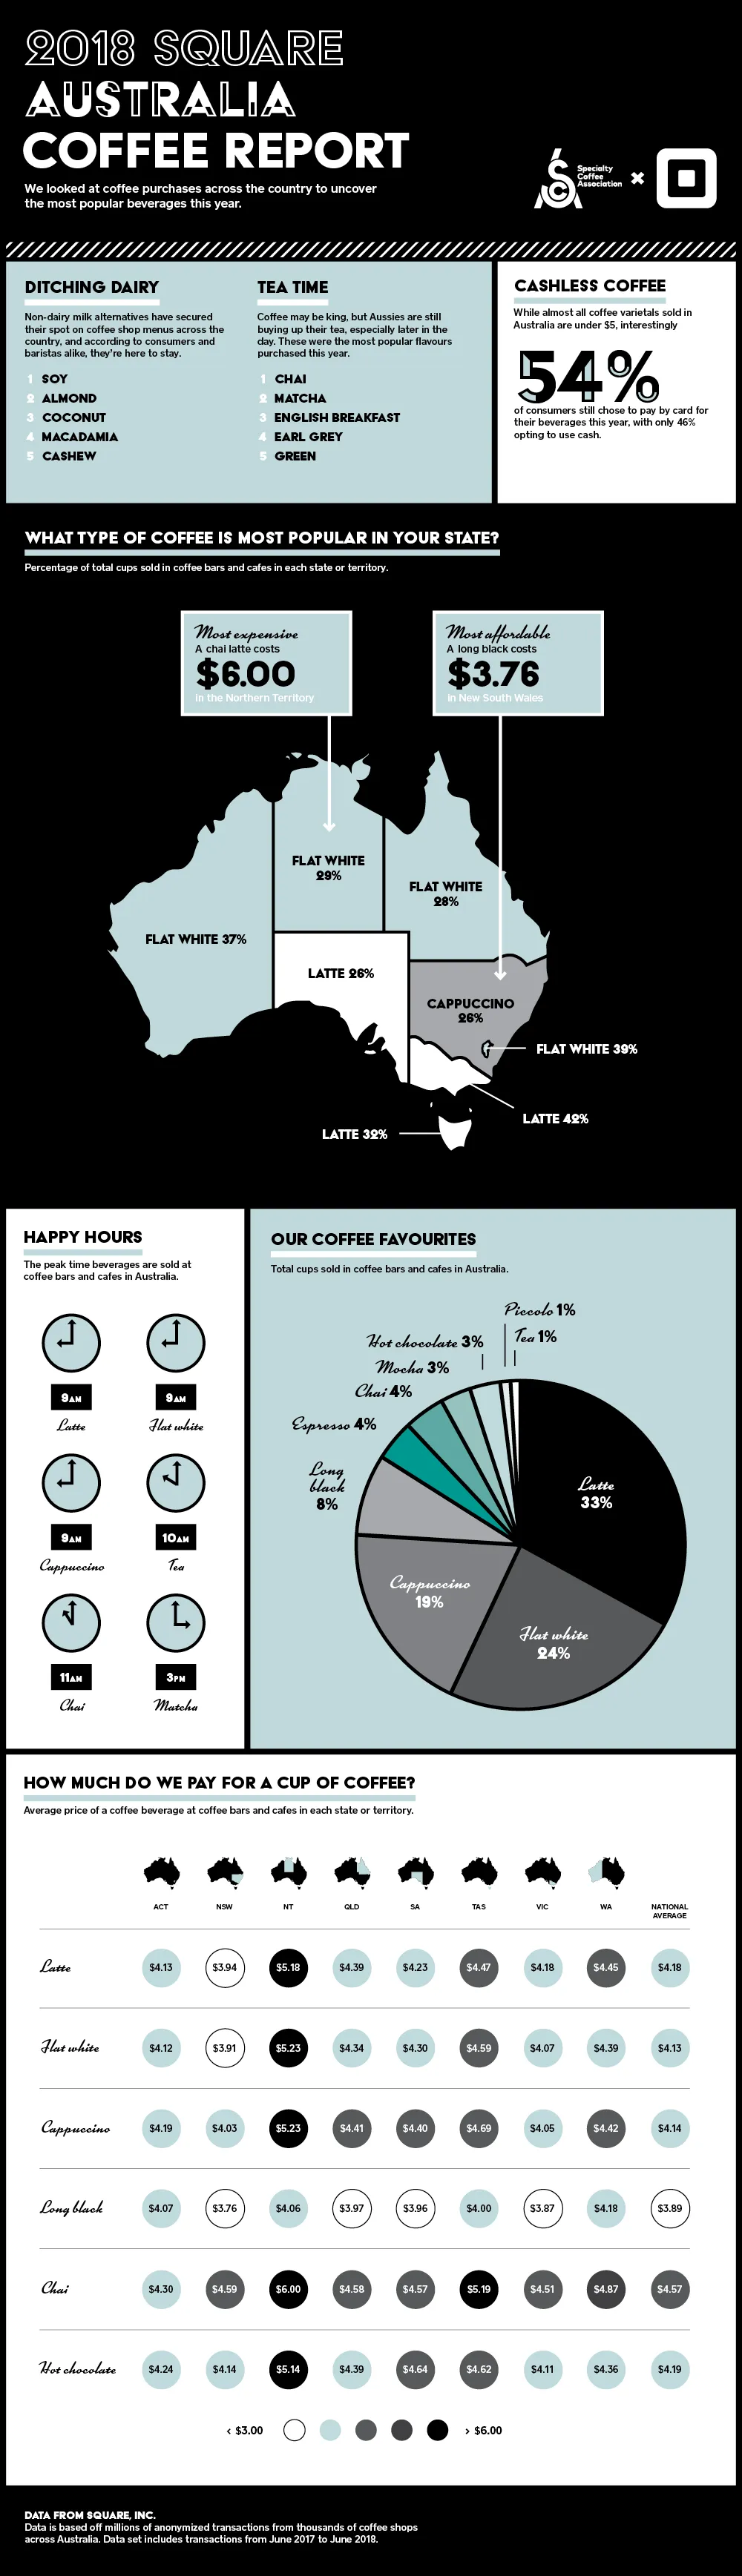
The 2018 Square Australian Coffee Report shows us that customer demand and price sensitivity can vary dramatically by state, as seen by coffee drinkers in the Northern Territory (NT) who spend on average $1 more on their beverages than consumers in New South Wales (NSW).
Prices across the board were up only a few cents from 2017, with Aussies still spending more on the sweeter flavours of mocha and chai. The cheapest coffee in each Australian state is still the traditional long black — the only coffee that consumers fork out less than $4 for.
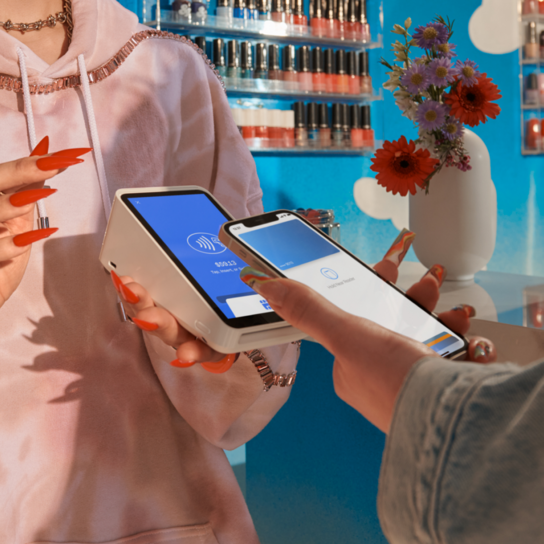
Is coffee going cashless?
Interestingly, despite the low price tag for coffee, Square’s data revealed that the majority of consumers (54%) chose to pay with card over cash (46%) when it came to purchasing their coffee beverages this year.
With Australia’s increasingly cashless society leaving no industry untouched, a state-by-state breakdown of the data showed that while most states followed the national trend, coffee-buyers in NT and South Australia (SA) were even more likely to pay by card, 69% and 68% respectively. Meanwhile, the Australian Capital Territory (ACT) was the only outlier region that preferred cash, with only 36% of people there opting to pay by card for their coffee.
Australia’s most popular coffee
While the latte is still the best-seller across the country, its popularity has actually dropped over recent years, with total cups sold decreasing from 43% to 32% since 2016. Flat whites have remained steady this year but the time-honoured cappuccino has made a resurgence, with sales jumping from 12% to 19% over the same period.
State-by-state data also showed the cappuccino overtaking the flat white as the preferred coffee in NSW this year.
The popularity of flavour-infused brews hasn’t slowed in 2018. Year-on-year growth showed matcha-infused coffee sales were up 80% and chai sales remained strong, up 70% from October 2017. Chai was again the most popular order when it came to the popularity of tea, followed closely by matcha, English breakfast and earl grey.
We also saw more non-dairy milk alternatives added to menus this year. While soy remained the most popular choice, nut-based alternatives are gaining momentum with almond, coconut, macadamia and cashew milk rounding out the top five picks for Aussies.

All day, everyday
It turns out caffeine isn’t just a morning necessity with sales of our favourite drinks peaking at different times through the day. The morning rush saw the stronger lattes, flat whites and cappuccinos hit their peak at 9am, while tea picked up at 10am and then saw another lunchtime spike at 1pm.
Our favourite flavoured brews, chai and matcha, also saw later surges, with chai sales hitting their sales peak at 11am and matcha at around 3pm.
The power of data
This report was pulled together using Square Dashboard, with data collected and analysed from the millions of cups of coffee sold on the Square platform at hundreds of cafes and coffee bars across the country. Data insights are extremely valuable to help business owners make smarter, more informed decisions about how to run their businesses.
Square Point of Sale is a free and powerful reporting toolkit available to every Square seller to access their sales data in real time. Sellers can instantly access information that tells them what products are selling the best, the average transaction size per customer, the frequency of customers, sales per employee and how other locations may be tracking.
So, whether you’re opening a coffee shop or starting your first business, Square is a great solution to help you keep track of the numbers.
![]()