
Table of contents
Data visualisation is the graphical representation of information and data. Communicating data using visual elements like charts, graphs and maps makes it easier to identify and understand patterns, trends, and outliers that may go unnoticed in traditional reports and spreadsheets.
A good visualisation removes the noise from data and highlights valuable information. For this reason, data visualisation can be an important tool to bring the story behind your business’s numbers to life and empower you to make informed, data-driven decisions.
Some popular data visualisation techniques include bar charts, line charts, scatter plots, pie charts, stacked bar graphs and heat maps. The right approach for your data challenge will depend on the data you’ve captured and what you’re trying to use it to understand.
Why use data visualisation?
The human brain processes visual information better than it processes text and numbers. Data visualisation is effective because it turns numbers into aesthetically pleasing visuals (graphs, charts, maps and more) to support a more comprehensive understanding of the data and better decision making.
To be effective, data visualisation must match the data set to the right visualisation category. For example, if you’re looking to track your sales performance by hour, a bar chart or line graph would be a good choice. If you want to understand the percentage of overall sales that each staff member has delivered, a pie chart communicates this information clearly.
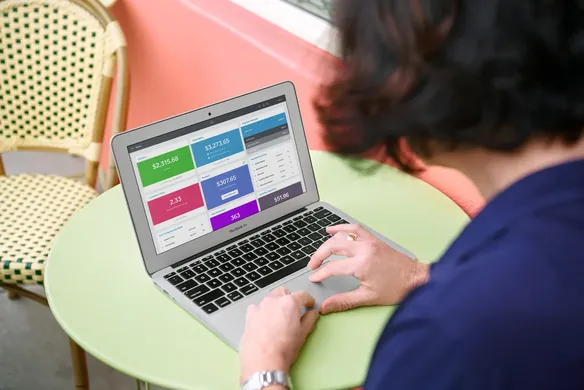
Your business collects valuable data in the course of your everyday operations. From capturing sales, employee performance, changes to inventory and more, a quality point of sale (POS) system like Square Point of Sale collects data about every transaction – and presents it in an easily digestible, actionable format in your Square Dashboard.
What are the benefits of data visualisation?
Some of the key benefits of data visualisation are:
- Drives efficiency. Data visualisation makes it easier to spot patterns and trends in your data. There’s no need to sift through spreadsheets or tables – it’s simple to identify insights and key takeaways.
- Improves understanding. A visual representation is more easily understood by most people. For this reason, sharing a chart showing key metrics that you want your team to understand – rather than presenting this information on a spreadsheet or in a table – is more likely to resonate with employees who don’t consider themselves to be ‘data people’.
- Provides transparency and encourages engagement. Sharing key charts or dashboards across the team regularly is a great way to ensure all employees understand important metrics and know how the business is performing. Consider posting these in the lunchroom or another shared space and updating them weekly or monthly.
When should you use data visualisation?
Data visualisation is useful regardless of the size of your data set, but particularly if you’re working with vast amounts of data. Because data visualisation speaks to our brain differently than numbers on a spreadsheet, it’s worth considering whenever you’re grappling with a complex data challenge.
What’s the difference between data visualisation and data analytics?
Data visualisation looks at representing data in a visual format, whereas data analytics goes deeper – examining data sets to get valuable insights and draw conclusions about that data. In reality, the two terms are often used interchangeably.
How does Square Analytics help you make the most of your data?
Tools like Square Analytics use real time-data and data visualisation to help retail businesses make fast, informed decisions. Backed by powerful insights into key retail metrics, Square Analytics is a comprehensive retail dashboard that uses visual elements to support a quick and easy understanding of business performance.
- Keep track of performance 24/7 from wherever you are. Sign in to your Square account to access all your data, or check your most crucial sales information from your mobile device on the free Square Dashboard app.
- Use your sales data more effectively. By capturing every transaction, Square Analytics supports you to run your small business smarter using sales data. See what’s selling and when with transaction-level sales reports.
- Get to know your customers better. Understand your customers in a whole new way. Find out who your top customers are, how much they spend, what they’re buying, and how often they return.
- Insights delivered to your inbox. Get simple daily summaries of your most important metrics emailed to you automatically.
- Create your own data visualisations. You can download CSV files of data, including transactions and sales by item, and use this information to create your own visual representations of data trends.
- Manage your inventory more effectively. See what’s selling and when, which products are purchased together and more. You can manage your inventory from anywhere with Square.
Square Analytics makes your data easy to understand, supporting you to identify and act on insights without hunting through spreadsheets. Powerful reports give you a real-time and historical view of key business metrics, and you can access all your data by logging into your Square account.
Learn more about Square Analytics and get started with a free Square account today.
![]()


