


In a Neighbourhood Nation, the local economy is more important than ever
Local business ownership is never easy, but the last few years in Australia have felt especially hard. Particularly for small, independent businesses. The pandemic. Global shortages. A weaker Aussie dollar. Inflation, interest rate rises and the cost-of-living crisis. One hit after another.
How can local businesses expect to survive – let alone thrive – in that context? But for all the negative impacts of the last few years, there have been a few bright spots for businesses. Especially in our neighbourhoods. In our local economies.
We’ve all felt it. Since the pandemic, we’ve been spending more time than ever in the suburbs. And we’ve been spending more than ever in them, too. Last year, the Square Neighbourhood Nation report revealed that post-pandemic loyalty and spend in Australia have moved from the CBD to the suburbs. Rather than the expected post-pandemic return to business-as-usual, millions of Square transactions across Melbourne and Sydney suggest a permanent – and ongoing – shift.

54%
of Australians feel more connected to their neighbourhoods than they did five years ago, and 68% of monthly dining spend goes towards neighbourhood venues – compared to 32% in the CBD1
Table of contents
That shift we made towards living, working and socialising outside the CBD started in 2020 and has consolidated every year since. But if 2025 was the year Australia became a Neighbourhood Nation, what does that mean for 2026? What will local economies look like moving forward? And how can Australia’s local businesses capitalise on this change in the way we live within our cities?
How Australia became a Neighbourhood Nation
Square transaction data2
- CBD spend stall started during the pandemic: Sydney suburban transaction volume grew 75% between 2019 and 2020, while the CBD fell 4%. In Melbourne, suburbs rose 34% while the CBD dropped 39%.
- Suburban spend higher: In July 2025, the average food and beverage spend was $15.15 in Melbourne’s suburbs vs $13.53 in the CBD, and $14.52 in Sydney’s suburbs vs $12.87 in the CBD.
- Loyalty moves local: Repeat customers make up 4.6% in Melbourne suburbs vs 3.8% in the CBD, and 4.5% in Sydney suburbs vs 4% in the CBD in H1 of 2025.
Consumer sentiment3
- CBD visits declining: Two in five Australians (40%) now visit the CBD less than once a month.
- CBD avoidance rising: Almost one in five (19%) say they actively avoid the CBD altogether.
- Local life dominates: Beyond dining, consumers prefer their neighbourhoods for groceries (88%), time with family and friends (78%), cafés (75%), shopping (66%) and cinema trips (64%).
That’s where the Square 2026 Local Economy Report comes in. Square analysed anonymised transaction data in capital cities throughout Australia, revealing how money circulates within a local economy. Then, we surveyed nearly 1000 Australians about how they shop and spend locally, and what they want to see from their local businesses.
By pairing real-world spending patterns with consumer sentiment, this report outlines:
- The importance of regulars and the network effect within a local economy
- The keys to earning – and retaining – local loyalty
- How businesses can reach and serve locals in 2026 and beyond
The key message for businesses that emerges from these findings is clear: if you look after your locals this year, your locals will look after you.

Regulars drive 5x revenue: Why they’re the lifeblood of your business
Regulars are crucial to the financial success of all local businesses.
5x
Across Australia, a regular is worth 5x more than a transient customer.4
- Strongest effect in Darwin: Over a year, a regular is worth an estimated 6.36x more value than a transient customer.
- More loyalty up north: Brisbane and the Gold Coast boasted more annual regular value relative to transients than their southern counterparts Adelaide, Hobart and Perth.
- In Australia’s two largest cities – Sydney and Melbourne – regulars constituted just over 4x more annual value than transients, suggesting a link between more populated cities and less regular-reliant local economies.
Key terms
- A regular: A customer who has purchased from the same business on at least four separate days within a one-year period.
- A network connection: When two businesses share at least one regular customer.
73%
of Australian consumers say they purchase from a local retailer or restaurant within their postcode at least once a week.5
Below is an anonymised seller network illustrating neighbourhood business connectivity through regulars in one of inner-Melbourne’s most tightly knit suburbs. Each node represents a business in the given postcode, and there is a line between them if they share at least one regular (i.e., a person who returned at least four times in 2025). The bigger the node, the more connections a business has.

These connections form a neighbourhood network where one business’ growth supports the next through a shared loyal customer base. In North Melbourne, home to some of the city’s best cafés and restaurants, there’s a clear concentration of shared regulars between food and drink sellers. But these locals also have plenty of other interests in common, too – particularly in retail.
This dovetails with Square’s consumer survey findings. Whenever someone goes to a business in their neighbourhood, it’s common for them to visit another one: at least 84% of shoppers periodically make several shopping stops on the one trip.6
In Melbourne overall, 74% of shared regulars were between two food and drink sellers. Sydney was similar, with 72% of shared regulars between food and drink sellers.7 If hospo operators want more regulars, they should seek out good neighbours.


Repeat customers have always been essential for business, but in Australia, data shows that the impact of regulars on the balance sheet has become increasingly pronounced.
Community from crisis
Across Australia, 2021 saw a substantial jump in the share of regular revenue.
During times of crisis, in a time of lockdowns and staying home, the local economy sustained. And regulars were more important than ever. But this wasn’t just a flash in the pan. Several years after the pandemic, it appears this even greater emphasis on regulars was long-lasting and could become permanent. In 2025, the national share of revenue contributed by regulars grew, while that of transient customers dropped.
Takeaway: if you’re opening a business in the suburbs, your strategy needs to take a local-first approach.
The most frequented businesses in Australia’s local economies
Square asked Australians how often they visit local businesses.8 Here’s what they said:
-
65% of consumers visit retail shops most often.
-
62% consider cafes their favourite hospitality business in the area.
-
49% want quick-service restaurants close to home.
-
31% want to go to local beauty businesses within their postcode.
Big things come from small – but frequent – transactions
Across Australia last year, the data was clear. Transient customers tend to spend more per transaction than regulars in every major Australian city. In some cities such as Sydney, transient customer average spend was nearly double that of regulars.9
But regulars were still five times more valuable over the course of a year.10 Because those little transactions add up. Over days, weeks, and months, these consistently returning customers contribute more than the big one-off spend from someone who’s not coming back.

12
the national average number of annual visits a regular customer makes to a business they frequent in their neighbourhood.11
That data was borne out by consumer sentiment, too. Of the Australians we surveyed, 91% of locals who become regulars at a business either spend the same, or more, than before.12
Takeaway: Regulars can contribute higher average spends, but their true value comes from repeated custom. Focus on upping the frequency of visitation, not the spend.
There’s a demonstrable appetite for neighbourhood hospitality – 48% of surveyed Australian consumers spend at restaurants, dine-in or takeaway, at least once a week. There’s an even higher reliance on retail: 63% spend at a retailer in their postcode each week.13
Beauty businesses like salons, spas and hairdressers, given their more infrequent nature, aren’t being visited weekly too often. But there’s still a palpable preference for local ones as opposed to ones farther from home – 81% spent on beauty within their suburb at least once last year.14
Square insight: More marketing, more regulars
If you want more regulars – and better relationships with your current ones – consider refreshing your marketing. In Australia in 2025, Square data shows that 93% of those using Square email marketing and loyalty features had regulars. Only 39% of sellers without email marketing or loyalty programs had regular customers.15
Consumer desire to spend locally, and to become a local regular, is there. 35% of Australian consumers feel an important – and even “essential” – connection with their favourite local business within their postcode.16
That desire can be harnessed by providing locals what they need and want to see in their community.
In the next section, we’ll outline exactly what consumers are looking for right now – and how businesses can give it to them.

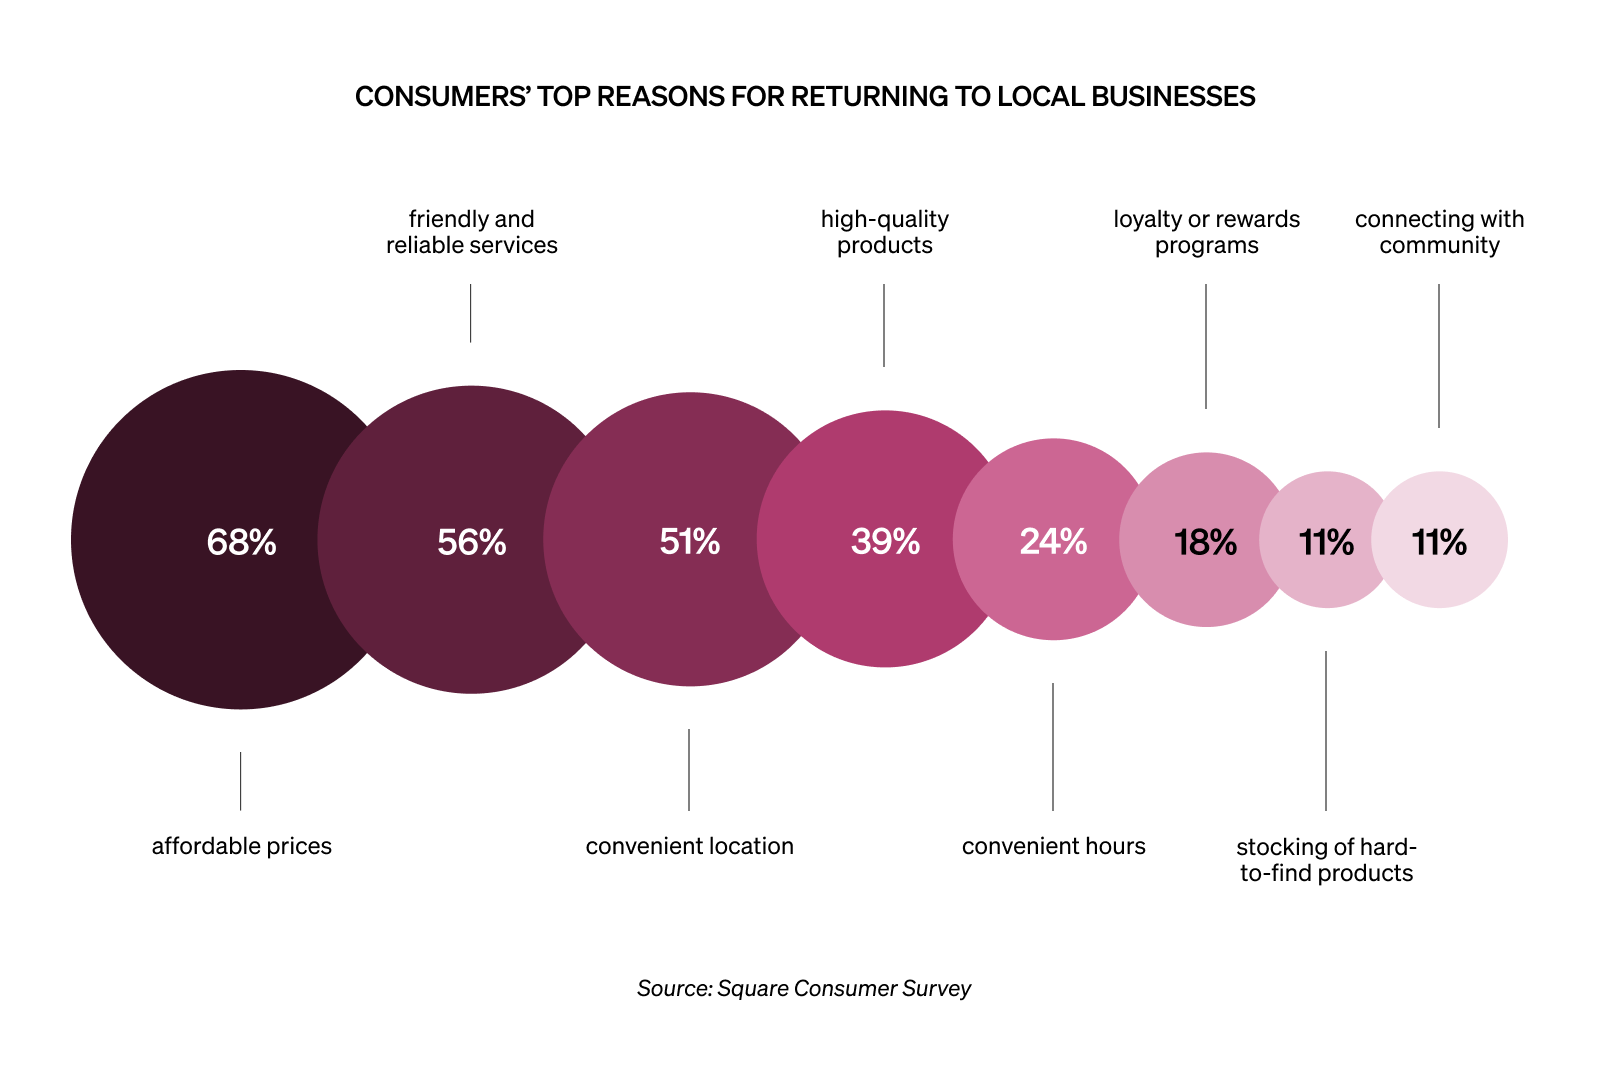
Convenience and affordability are driving local loyalty
Cost-of-living pressures can be overcome
Everyone’s been feeling the pinch recently. Business margins are slim and consumers’ hard-won disposable income is not easily given over. For spending in the local economy, convenience and community-mindedness are less of a priority than cost right now. Yet quality is still a very important consideration for 72% of locals.17
That extends beyond hospitality and retail – affordability is the dominant priority for consumers for all local spending.
95%
of Australians say that affordability is a somewhat-to-very important factor when choosing where to shop or dine18
Spending in the Neighbourhood Nation has moved to the suburbs
As established in 2025’s Neighbourhood Nation report, Australian CBDs’ visitation decline coincides with a commensurate increase in suburban transaction volume. Average spends in suburban Sydney and Melbourne in 2025 were higher than CBD spends by $1.65 and $1.62 AUD respectively.19
44%
of consumers in Australia spend over 50% of their monthly shopping and dining within their postcode.20
That retreat from our city-centres has been a boon for local operators.
Seventy-five percent of Australian consumers spent at least a quarter of their retail and hospitality budget, each month, in their neighbourhoods. Beauty purchases at businesses such as salons, or general services like mechanics tell the same story: most consumers in 2025 spent the same amount in their neighbourhood as they did in 2024, across every category.22 Some, despite cost-of-living pressures, even spent more on these discretionary goods and services. It’s clear that this move towards suburban spending is more than a pandemic-influenced trend. It’s here to stay. Later on, we’ll be looking at how consumers are planning on spending locally in 2026.
Businesses need to keep convenience top of mind
Convenience has always been the backbone of the local economy: early morning milk runs, last-minute appointments after work, pizzas on takeaway night. That’s what the neighbourhood’s all about.
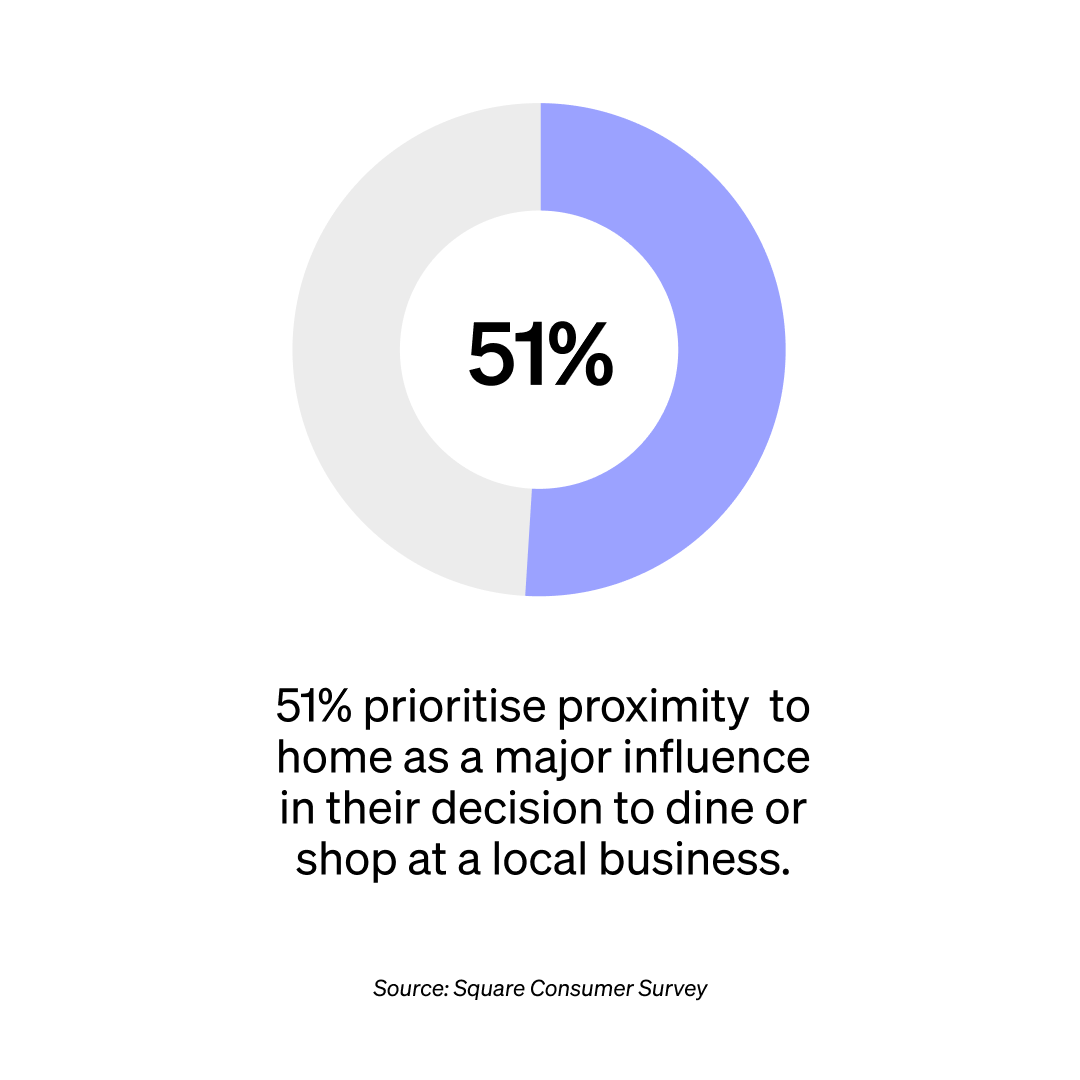
But with everything – especially time – coming at a higher premium now, convenience is more important than ever. And though wide product ranges and opening hours are well liked by consumers, there’s one kind of convenience that clearly reigns supreme: location.

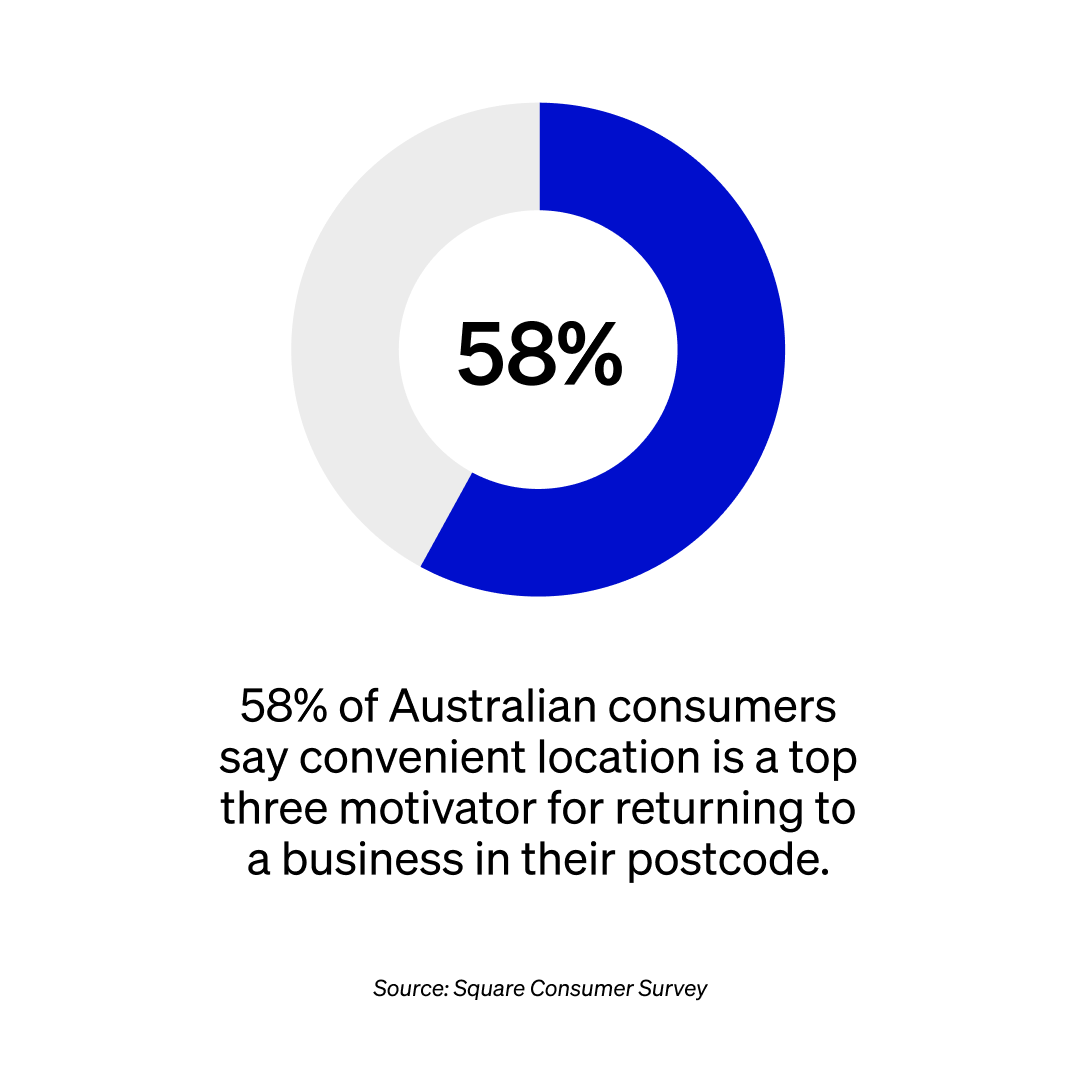
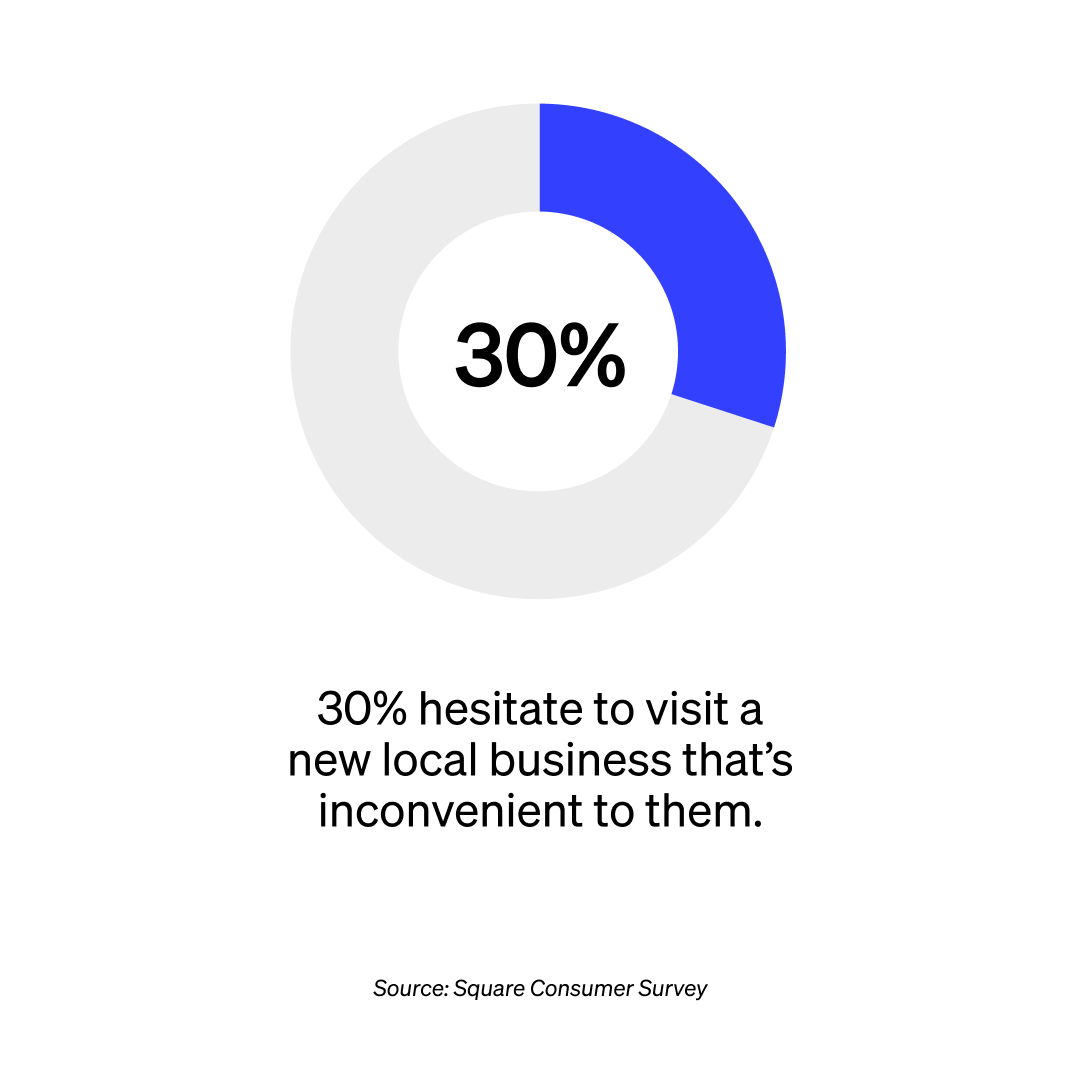
It cuts both ways, too. When asked about the main impact local businesses have on neighbourhoods, the responses were emphatic: 60% of consumers said they made the suburb a more convenient place.
Today’s cost-of-living pressures make affordability a higher priority than ever. With that said, the financial pain is being unevenly distributed, and Square data indicates more pain for the CBD than the suburbs.
We’re now spending more of our time – and budgets – than ever in the neighbourhood. And where a business chooses to be within that neighbourhood matters. So for local operators, convenience is still king.

How businesses can reach and serve their local community
It’s the vibe of the thing
Housing affordability and availability in Australia have played an important role in the transformation of the country’s suburbs – and its local economies. Population is on the rise, and so is higher-density living.
This is compelling people to spend more time outside the home, within the neighbourhood. This rise in demand for “Third Places” to visit outside of work and home could explain the growing importance of atmosphere in people’s estimation of a local business.

55%
of consumers consider ambience and atmosphere top contributors to having a memorable experience at a local business.23
In a fast-paced, transient environment like the CBD, businesses can perhaps get away with de-prioritising their atmospheres. But in the neighbourhood, people want somewhere to linger.
A great atmosphere comes from more than just décor and a good playlist. 57% said staff knowledge of products and services was a major priority for them, while 48% said a memorable experience comes from feeling a personal connection with staff and community.24
One of the best investments a local business can make is in developing a strong culture of warm service and deep knowledge in its staff. That will make your business somewhere locals will want to keep coming back to – and stay for a long time once they get there.
Another way is through digital enhancements – such as smoother payment, pick-up and booking – that make the customer experience even better.
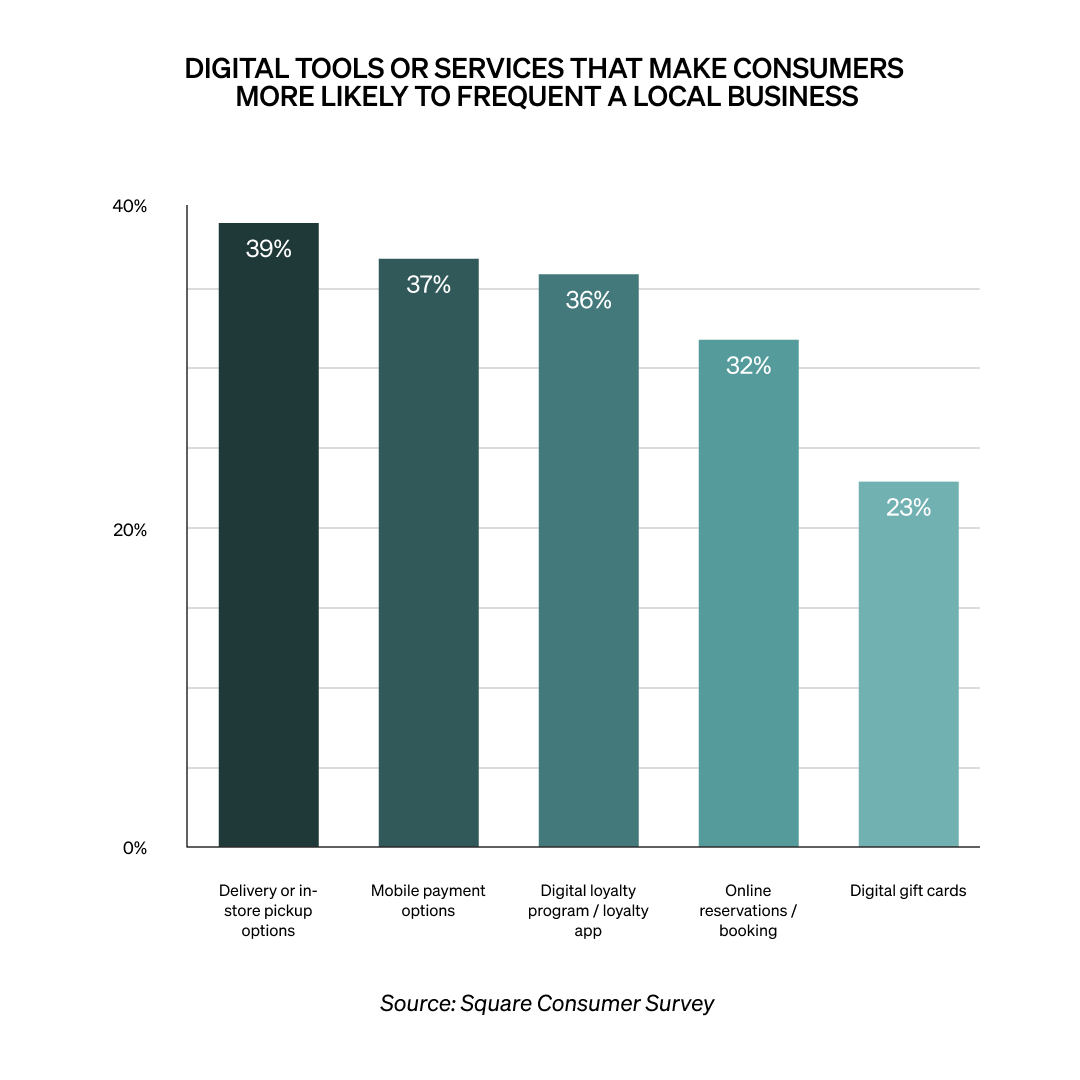
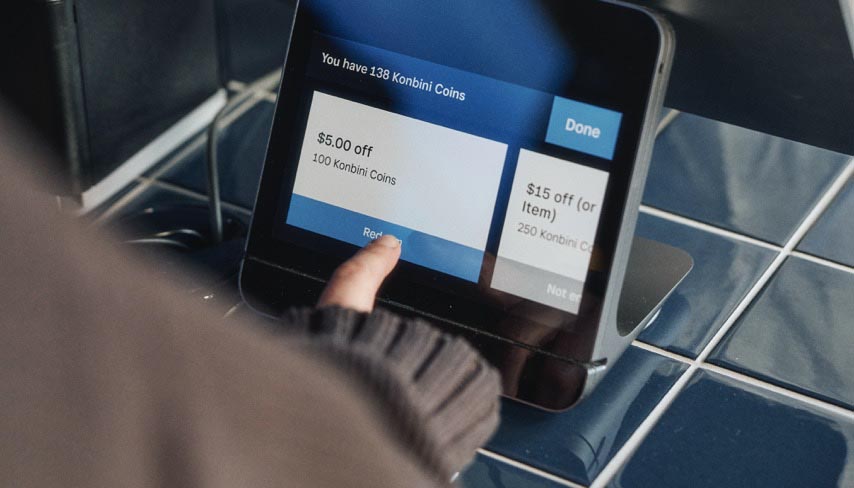
Consumers’ preference of digital tools here is illustrative. They want tech that actually enhances the in-person experience of visiting somewhere in the neighbourhood: easier ordering, smoother payments and reservations, and intuitive discounts that incentivise repeat visits.
Locals love loyalty
Affordability, convenience, and atmosphere are the pillars of a successful business in the local economy. And though they may be obvious to identify, they’re much harder to implement. In many ways, they’re a throwback to the fundamentals of bricks-and-mortar trade.
Another classic making a comeback in Aussie neighbourhoods is the good old-fashioned loyalty program – redesigned for modern times.
Loyalty tools, which reward repeated custom and can offer an array of discounts and deals, were the highest-growing Square marketing feature in Melbourne and Sydney in 2025. This is consonant with consumers’ growing prioritisation of affordability and convenience.

4x
the increase in average daily transactions sellers using a marketing product saw in 2025 compared to sellers that didn’t use a marketing product.25

3x
the increase in daily spend sellers using a marketing product saw in 2025 compared to sellers that didn’t use a marketing product.26
According to consumers, 36% say that having a loyalty program or app would make them more likely to frequent a local business.27 In local economies right now, it pays to be – and reward – a loyal customer.

The best – and worst – ways to reach customers right now
Most locals want to hear from the businesses in their postcode. But there’s a right way and a wrong way to do it.
In 2026, email remains consumers’ favourite way to be communicated with by local businesses, with 41% indicating it as their top preference. Social media was split – 29% said they liked to engage with content, but just 24% said they wanted to receive direct messages through social media. Just over a quarter – 27% – indicated a desire to be reached through text messages.28 For some, it’s a more direct and immediate way to receive information. For others, it’s an intrusion.
Taken together, these findings suggest that right now consumers prefer to engage with local businesses on their own terms – checking their inbox and social media accounts – rather than being reached out to directly.
Now that we’ve outlined what locals want, and how to tell them about it, the final section outlines how consumers plan on spending in the local economy in 2026. And what the financial forecast in our local economies looks like for the future.

How locals will be spending in 2026 – and how businesses in the neighbourhood can capitalise
Many consumers are feeling bullish about their spending habits this year – though some businesses in the local economy stand to gain more than others.
The 2026 spending forecast
Despite today’s strong financial headwinds, there’s cause for optimism in the local economy, with consumers expecting their discretionary neighbourhood spending to hold steady this year.

68%
of consumers expect their local shopping and dining habits to remain the same this year.29
And Square transaction data suggests that consumers won’t just be spending the same amount – they’ll lean towards buying the same things, too. Across every capital city, and the Gold Coast, a regular at a beauty business typically purchased the same item 74% of the time. In hospitality, within those same cities, a regular customer orders the same thing 60% of the time.
And Square transaction data suggests that consumers won’t just be spending the same amount – they’ll lean towards buying the same things, too. Across every capital city, and the Gold Coast, a regular at a beauty business typically purchased the same item 74% of the time. In hospitality, within those same cities, a regular customer orders the same thing 60% of the time.30
Takeaway: 2026 should be a year of consolidation, rather than innovation, when it comes to the line-up of goods and services your business is offering the local economy.
Furthermore, consumers have also indicated an openness – or at the very least, a tolerance – for price increases by local businesses: 63% of respondents say they’d be “somewhat” to “very” likely to continue shopping at local businesses who raise their prices. But only if these prices were raised to offer increased value, like with better service or quality enhancements.31
Locals aren’t naïve about the high cost of doing business in Australia. Or about inflationary pressures driving up prices. No-one loves paying more for anything, but if a local business has earned its customers loyalty, then there is an understanding for increasing prices – within reason. A note on the counter blaming a new price on the rising cost of coffee beans or alternative milks might not cut it. But the amount of your price increase needs to seem reasonable and “pass the pub test.” And it needs to be communicated clearly and honestly.
Where consumers are most – and least – likely to shop in 2026
When consumers need to reduce overall spending, some local businesses will inevitably be more affected than others. If the broader economy takes a turn for the worse – like another surprise Reserve Bank interest rate rise – Australia’s local economies will take a hit too. And people will spend less. These are the neighbourhood businesses that will be most, and least, affected, by a downturn in local spending.
| Most affected businesses32 | Least affected businesses |
| Breweries and bars (28%) | Health care professionals (6%) |
| Full-service restaurants (25%) | Retail shops (12%) |
| Spas / wellness services (23%) | Quick-service restaurants (18%) |
These findings suggest that businesses with more premium pricing or that are easily competed with are the most susceptible to fluctuations in consumer spending. The things that make full service restaurants so great – beautiful design, attentive service – also make them pricier. And therefore more vulnerable than their more affordable quick service counterparts.
Breweries and bars, which compete with cheaper bottle shops and domestic consumption, face similar challenges. On the retail and service side of the local economy, specialist retailers or businesses with highly specific equipment or high-skilled professionals, such as beauty services or dentists, are more insulated.
On the hospitality end, it’s a story about affordability and competing with at-home consumption. If the economy’s experiencing turbulence, then bars, breweries and full-service restaurants have to find ways to lower prices or provide more value to locals.
What is one thing local businesses could do to earn your loyalty or better serve your community?
Here’s what consumers told Square:33
- “Call me by name”
- “Focus on community needs – not the tourist dollar.”
- “Offer discounts to loyal customers”
- “Discount for locals.”
- “More bang for my buck”
- “Genuine support for local causes.”
- “Hire more friendly staff.”
- “Improve ambience.”
- “Build better, genuine, personal relationships with returning customers – and offer them discounts.”
Just 19% of consumers surveyed expect to shop and dine more in 2026 than they did last year; under a fifth of locals. However, with 63% intending to spend the same amount, there’s considerable cause for optimism.34 Particularly for businesses who are already operating successfully.
It’s a shame more consumers aren’t seeking to spend greater amounts in their suburb this year, but it aligns with reality. And it means that if your local business was working in 2025, there’s a good chance it will continue to work well in 2026 and beyond.
Take care of your locals, and they’ll take care of you
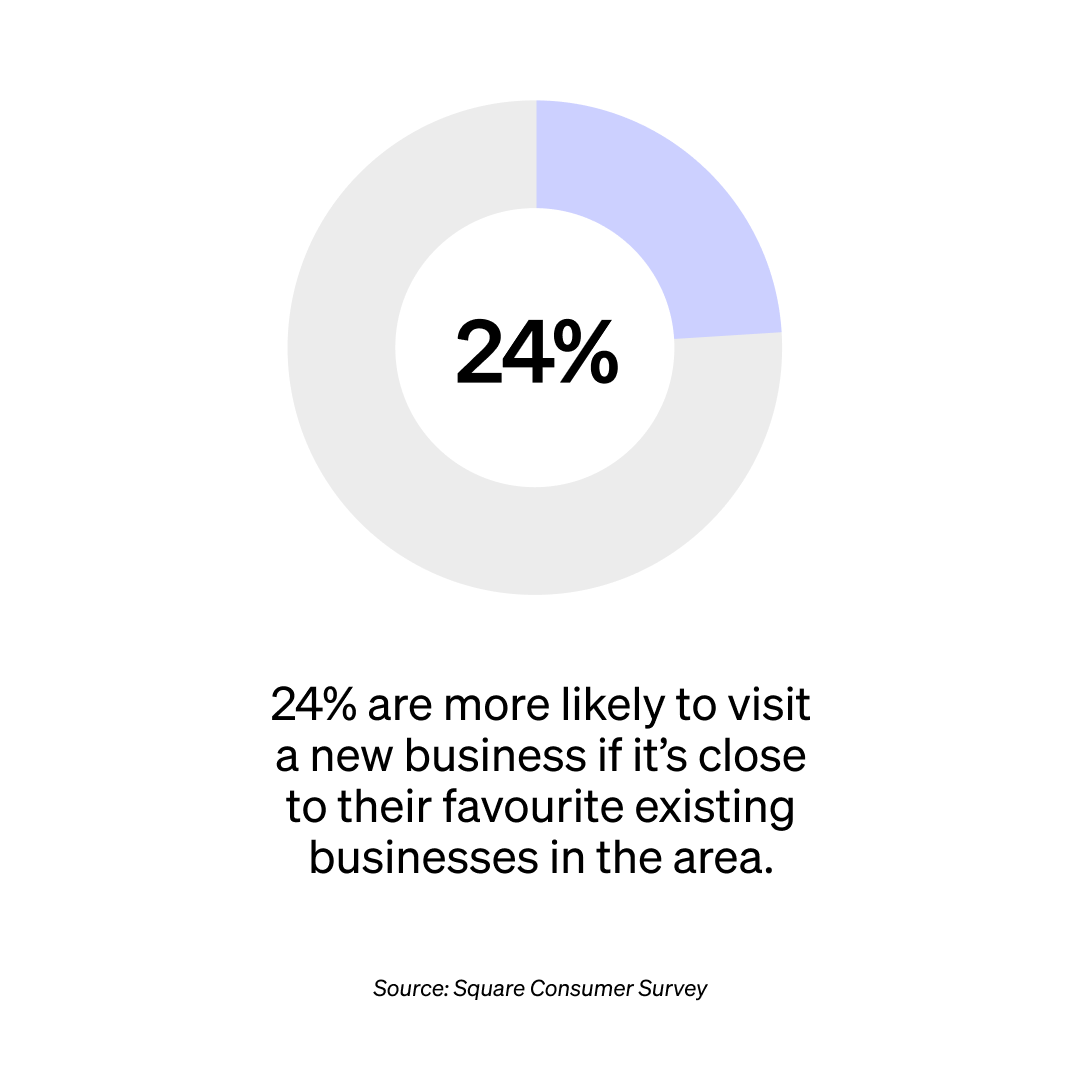
Australian spending has been shifting away from the CBD and towards the suburbs for the past five years. Now that we’re a Neighbourhood Nation, our local economies have become more central to daily life than ever. And these neighbourhoods have never been a more tightly knit network of inter-connected businesses. Restaurants, cafes, shops, barbers, gyms and hairdressers – all sharing regulars, all sharing a community. 27% of Australian consumers consider proximity to their other favourite businesses an important factor when considering visiting another nearby business.35 One successful business in the local economy is an opportunity for the other ones in the area.
Higher suburban spending has only underlined the importance of regulars. The local businesses that will best succeed in 2026 will do so by winning the custom of new regulars and deepening their relationship with existing ones. They can achieve the former by focusing on convenience and affordability. And they can do the latter by enhancing their service, ambience and rewarding loyalty with meaningful value. Digital tools are still an essential consideration for modern local businesses – particularly ones that improve the offline, in-person experience. By doing this, businesses will earn regulars who, though they spend less at a time, will spend much more at your business in the long run than a transient customer.
These are difficult times for both consumers and businesses. But there’s a feeling of optimism, and a renewed enthusiasm amongst locals to spend more inside their postcode. 74% of consumers are somewhat to very confident that they will spend the same or more within their local area in 2026.36 The opportunity for growth is there, and the right businesses will claim it.
Being out in the suburbs used to be a hurdle to overcome. Now, being a local business is your greatest competitive advantage.
Footnotes
- Per Square Neighbourhood Nation Report data
- Per Square Neighbourhood Nation Report data
- Per Square Neighbourhood Nation Report data
- Per Square Transaction Data
- Consumer Survey Q3: In the past 12 months, how often have you made a purchase at the following types of local businesses in your neighborhood (defined by your zip code)? Types of local businesses: Restaurants (dine-in, takeout or delivery); Retail stores; Beauty businesses (salons, spas, barber shops); General services (home contractors, auto shops, etc.)
- Consumer Survey Q8: When visiting a local business, how often do you also visit other types of nearby local businesses (e.g., visiting a café and a retail store, visiting a salon and a restaurant, etc.) during the same trip? Results – Always: 7%; Often 30%; Sometimes: 47%; Rarely: 11%; Never: 3%; Not sure: 1%
- Per Square Transaction Data
- Consumer Survey Q7: Which types of local businesses do you frequent most often in your neighborhood (defined by zip code)? Options include: Cafes and coffee shops; Bars and breweries; Quick-service restaurants (e.g. counter service); Full-service restaurants (e.g. sit-down dining); Retail stores; Beauty salons / barber shops; Spas / wellness services; Gyms and fitness studios; General services (home contractors, auto shops, etc.); Other (please specify):; None of these; Not sure
- Per Square Transaction Data
- Per Square Transaction Data
- Per Square Transaction Data
- Consumer Survey Q4: When you become a regular customer at a local business (at least four visits per year), how does your spending usually change? Results – I spend more per visit: 18%; I spend about the same amount per visit: 73%; I spend less per visit: 4%; I have never been a regular customer at a local business: 3%; Not sure: 2%
- Consumer Survey Q3: In the past 12 months, how often have you made a purchase at the following types of local businesses in your neighborhood (defined by your zip code)? Types of local businesses: Restaurants (dine-in, takeout or delivery); Retail stores; Beauty businesses (salons, spas, barber shops); General services (home contractors, auto shops, etc.)
- Consumer Survey Q3
- Per Square Transaction Data
- Consumer Survey Q9: Which of the following best describes your relationship with your favorite local businesses? Results – Transactional: I shop there, but don’t feel a personal connection: 19%; Familiar: Staff recognize me, but we don’t interact much beyond transactions: 42%; Connected: I feel a personal relationship with the staff/owner: 26%; Essential: The business feels like part of my social/community life: 9%; I do not shop at any local businesses: 2%; Not sure: 2%
- Consumer Survey Q18: When choosing where to shop or dine, how important are the following factors? Factors – Price (affordability); Convenience (location or hours); Quality of products or services; Supporting local businesses in my community; Unique or personalized experiences. Options – Very important; Somewhat important; Not too important; Not at all important; Not sure
- Consumer Survey Q18
- Per Square Neighbourhood Nation Report data
- Consumer Survey Q5: In a typical month, what percentage of your shopping and dining do you estimate happens at local businesses in your neighborhood (defined by your zip code)? Results – 0-25%: 21%; 26-50%: 31%; 51-75%: 27%; 76-100%: 17%; Not sure: 4%
- Consumer Survey Q5
- Consumer Survey Q6: Over the last 12 months, how has your spending changed at each of the following local business types? Business types – Restaurant purchases (dine-in, takeout or delivery); Retail purchases (in-store and online); Beauty purchases (services or products at salons, spas, barber shops); General services (home contractors, auto shops, etc.). Options – Increased; Stayed the same; Decreased; Not sure
- Consumer Survey Q16: What aspects of a local business make your experience memorable? Options – Feeling connected to staff / community; Personalised experiences and recommendations; Staff knowledge of products and services; Atmosphere / ambience; Stocking of exclusive or hard-to-find products; Exclusive events or surprises; Other (please specify); None of these; Not sure
- Consumer Survey Q16
- Per Square Transaction Data
- Per Square Transaction Data
- Consumer Survey Q17
- Consumer Survey Q14: How do you prefer local businesses to communicate with you? Options – Email; Text message / SMS; Social media direct messages (e.g., Instagram DMs, Facebook Messenger); Social media content (e.g., through TikTok posts or Instagram stories); Website chat or messaging; Other (please specify); I do not want to receive any communication from local businesses; Not sure
- Consumer Survey Q21: Over the next 12 months, how do you expect your local shopping and dining behavior to change? Results – I plan to shop and dine locally more often: 19%; I plan to shop and dine locally the same amount: 68%; I plan to shop and dine locally less often: 7%; Not sure: 6%
- Per Square Transaction Data
- Consumer Survey Q20: If a local business raised its prices in order to offer increased value (e.g., better service, better products, exclusive offers), how likely would you be to continue shopping there? Results – Very likely: 17%; Somewhat likely: 46%; Not too likely: 22%; Not likely at all: 8%; Not sure: 7%
- Consumer Survey Q24: If you needed to reduce your spending, which two local business areas would you cut back on first? Results – Cafes and coffee shops: 16%; Bars and breweries: 28%; Quick-service restaurants: 18%; Full-service restaurants: 25%; Retail stores: 12%; Beauty salons / barber shops: 18%; Spas / wellness services: 23%; Gyms and fitness studios: 21%; Health and wellness (dentists, optometrists, etc.): 6%; General services (home contractors, auto shops, etc.): 12%; Other (please specify): 0%; None of these: 4%; Not sure: 3%
- Consumer Survey Q19: What is one thing local businesses could do to earn your loyalty or better serve your community? (Open field response)
- Consumer Survey Q21: Over the next 12 months, how do you expect your local shopping and dining behavior to change? Results – I plan to shop and dine locally more often: 19%; I plan to shop and dine locally the same amount: 68%; I plan to shop and dine locally less often: 7%; Not sure: 6%
- Consumer Survey Q12
- Consumer Survey Q25: How confident do you feel about your ability to continue spending at local businesses over the next 12 months given the current economic conditions (e.g., inflation, job market, cost of living)? Results – Very confident: I expect to spend more: 14%; Somewhat confident: I expect to spend the same, if not more: 60%; Not very confident: I expect to spend somewhat less: 21%; Not confident at all: I expect to spend significantly less: 5%
Disclaimers and data methodology
Neighbourhood Nation Report
Square’s Neighbourhood Nation Report used first-party data drawing on millions of transactions across Square’s platform across Melbourne and Sydney, and third-party market research. The third-party research, carried out by market research company, Pureprofile, involved a quantitative online survey of 1,017 adult participants. Fieldwork was conducted from August 4th to August 7th, 2025. The sample is nationally representative of the Australian metropolitan population in terms of age, gender, and location, based on the latest ABS Census figures. The definition of a loyal customer is constant throughout the analyses, defined as a customer who goes back to a seller at least 3 times.
Consumer Sentiment Survey Methodology
Square and Studio by Informa TechTarget conducted an independent survey of 987 consumers in Australia between September 23 and December 30, 2025. Respondents were screened to include a representative sample of age groups (18 to 61+) and geographical locations within Australia.
Data Methodology
Square analysed all buyer-seller interactions from January 2019 through December 2025. A buyer-seller relationship was considered to be “regular” if there were transactions between them on four or more distinct dates within a year; all other relationships were considered “transient.” Note that a single buyer can have both regular and transient relationships with different sellers. To calculate regular versus transient statistics, Square grouped transactions by regular and transient labels and computed summary metrics for each group, such as average spend and total transaction volume.
Network Data
Square isolated all “regular” buyer-seller relationships in 2025 based on the methodology described above. Square constructed city-level networks by drawing a connection between two sellers if they share at least one regular buyer. Most analyses are based on each network’s largest connected component – i.e., the largest subgraph where there exists a path between every possible pair of nodes.
Network visualizations represent the subgraph of a given city by postcode. For each city, we select the postcode that produces a subgraph containing 10-100 sellers and the greatest number of connections to demonstrate local connectivity and ensure visualization clarity.
Marketing Data
Square analyzed statistics based on enrollment in any of the following marketing products: Email Marketing, Text Message Marketing (US only), and Loyalty Programs. We compared two groups of sellers: enrolled in a marketing product versus not. To quantify the effects of activating a marketing product, Square analyzed all sellers whose earliest activation occurred on or after January, 2023, and compared performance in the three months preceding activation versus the three months following activation, only including sellers with at least 75 days of transactions in each period.
Download the
2026 Local Economy Report
Millions of companies use Square to take payments, manage staff, and conduct business in-store and online.
Download Now![]()