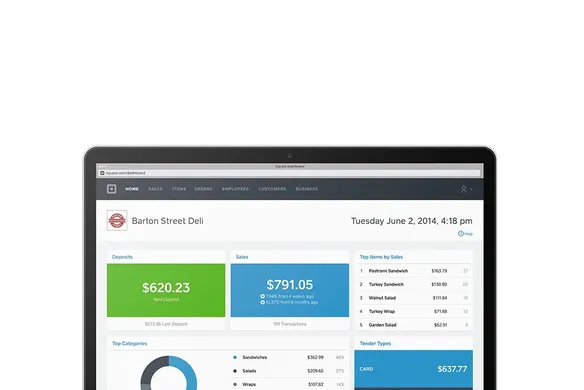
Have you noticed sales trends in your business? Have you ever thought about how these may change based upon what type of business you have? If you’re running a bar, your sales are likely to spike after 5pm, while cafes and coffee shops are more likely to see more sales at the beginning of the day when people are rushing for their morning coffee. The powerful analytics in Square Dashboard help Australian small businesses identify sales trends and use them to their advantage.
To help you see exactly when you’re selling the most, check out the Sales Trends report in your Dashboard For example, one of Melbourne’s busiest coffee bars sells (on average) a coffee every 45 seconds between 7 and 9am on weekdays. We won’t tell you which one, but needless to say, since switching to Square Point of Sale it’s been able to monitor this each week and add extra staff to its rosters to cover the rush.
Insights like these can help inform your business decisions and give you the confidence to know that you’re using data to run your business effectively. South Melbourne florist Michael from Azalea Flowers uses analytics to see what flowers are selling fastest, so he can quickly change his order when he’s at the flower markets early in the morning: “The level of information Square gives me about my business is really helpful when I’m doing my buying” he says.
Use the Sales Trends tab on the Reports page on your Square Dashboard to identify trends and make better business decisions.
![]()


