
Table of contents
As a business owner, you have to make critical decisions every day. And it’s easier to make the right choice when you have the best information, right at your fingertips.
That’s where business analytics tools come into play. They enable you to both predict the outcomes and consider the risks of various options so you can make a more informed choice.

Let’s take a deeper look.
What is business analytics?
Business analytics is the practice of turning data into insights that help you improve the way you manage your business. Analytics helps you better understand what’s working and what isn’t, so you can create strategies that help you grow.
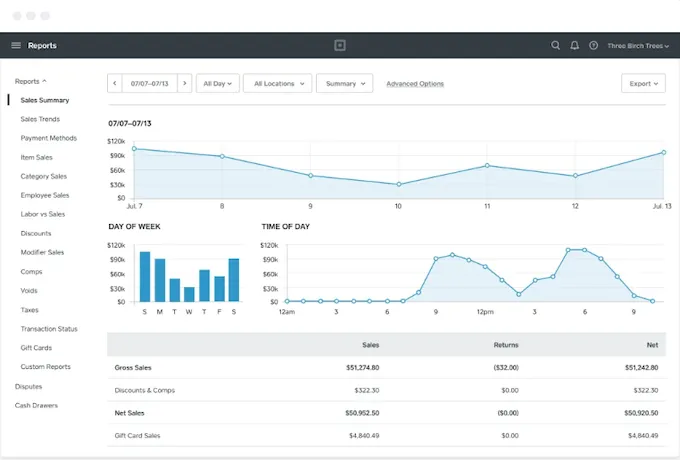
What does that look like in practice? Let’s say you’re tracking your daily sales through an analytics tool and you see that you’re busiest on Saturdays, Sundays and Mondays in the mid-morning and early evening (see below). That could inform how you staff your shop, set your hours and even stock inventory.
So the more data you have – and the better your tools allow you to parse through and understand it – the easier it is for you to make those decisions.
(If you’re doing research on different types of analytics tools, you might also come across the term “business intelligence.” What’s the difference between business analytics and business intelligence? Business intelligence is the category that analytics sits under.)
Learn more about the built-in analytics of Square Point of Sale »
4 types of analytics tools for small business
Business analytics tools can be a game changer for your business, especially if you are starting out. They can shed light on everything from how, what and when you’re selling to who is engaging with your brand and everything in between.
Here are a few tools with analytics capabilities that you should have in your business owner toolbox:
- Web analytics
Web analytics tools show you how many people are visiting your site, how they’re getting there and what they do once they’re there. If you have an online store, understanding how your customers interact with your site is crucial for maintaining and growing sales. Google Analytics is free and one of the most commonly used tools, although your website builder may also have built-in, high-level analytics. - Social media analytics
If you’re doing any of your marketing on social media, it’s important to understand how people are engaging with your content. Each platform has its own native analytics, which provides a lot of detail. Tools like HootSuite or Buffer provide an aggregated view across your accounts. - Point-of-sale analytics
Analytics within your point of sale digests all your transactions into reports that are easy to read and act upon. Square Point of Sale allows you to see sales trends over distinct periods of time, by product category, by location or even by employee. - Customer analytics
A customer relationship management (CRM) tool lets you store customers’ information so you can communicate with them. And you should be able to glean insights about your customers from those communications and marketing activities. For example, you should know what kinds of email they are more likely to open. If you have a CRM that integrates with your POS – or if your POS has a built-in customer directory like Square – then you can also paint a picture of their buying habits. Square POS allows you to identify new versus return customers, as well as average spend per customer.
How to select business analytics tools: 6 questions to ask
When you’re deciding which tools are right for your business, you want to use the same set of criteria when evaluating all the possibilities. That doesn’t mean you use the same criteria to evaluate social media tools as you do for web analytics. But you should use the same questions for all the vendors you’re evaluating in a single category.
Begin by making a list of all the contenders for each type of analytics tool, then ask a few questions:
- What is my goal in getting this tool? What specific insights do I want from it?
- What is the cost? Or better yet, what is the expected return on this investment? Is there a monthly charge and/or am I charged by user? Can I try it free at first?
- How easy to use is this tool? How long will it take me to learn it and then train employees on it?
- Where is my data stored? How do I access it? Do I need to be on desktop, or can I access it on mobile?
- Does it integrate with the other tools I already use?
- If the tool works for me now, will it also scale with me as I grow? How will it scale?
Once you’ve determined that an analytics tool fits your needs, then cost and ease of use are the most important factors to consider. There are plenty of low-cost options for analytics (Square POS is free and includes analytics). But not all tools are easy to use, so make sure you demo the product before you buy.
Accessing business analytics with Square
Square Point of Sale has integrated analytics and advanced reporting options so you can discover important insights to improve your business. Whether you need updated information on sales trends or inventory, if you’re using Square POS, you can pull that directly from your online Square Dashboard. Get started with Square POS.
![]()