Square Canada’s Winter Restaurant Report: How Canadian Eateries Are Adapting to Shifting Consumer Spending

Today, Square released its first Canadian Quarterly Restaurant Report, with this edition focused on full-service restaurants (FSRs). The report below brings together data and insights from across Square Canada’s food and beverage sellers and consumer surveys to examine dining trends, along with shifts in consumer spending and restaurant wages.
Canadians are rethinking date night
For 71% of Canadian consumers, cost is more of a factor this year than last when deciding whether to dine out, according to a new survey released by Square and commissioned by Leger.
While dining out used to be commonplace, 62% of Canadians now say they will reserve it for special occasions while only 12% still plan to eat out regularly. But for a small sector of would-be diners (10%), dining out is now being reserved for one thing: Date Night.
Jad Sfeir, owner of J’s Steak Frites in Toronto, has noticed the shift. “We’re definitely seeing a lot more reservations for two people, as well as an increase in large group requests, and people are indicating their celebrations when booking,” said Sfeir. “At the same time, bookings for four to six people have really dropped off, indicating we’re providing the backdrop for either a great date or special occasion in most cases. And we’re happy to be able to give our patrons a night to remember.”
Canadians are also considering alternatives for a night of romance out on the town. For example, cooking for a partner is a show of love, and 29% say they will opt to stay in and cook over going out.
The year of deliberate dining at FSRs
Outside of dates and special occasions, Canadians are being more deliberate about the decisions they make when choosing to go out for a sit-down dinner this year.
For 61% of respondents, the simple solution for managing spending on food is to dine out less often than last year. Still, Canadians love a good meal that they don’t have to cook themselves. As such, 46% said they still dine out, but will opt for less expensive, more casual restaurants over higher-end establishments.
Just over a quarter of respondents (26%) said they would simply cut out appetizers, cocktails or desserts in order to still have a night out, while 18% said they could save money but still dine out by swapping more expensive dinners with breakfasts, brunches or lunches.
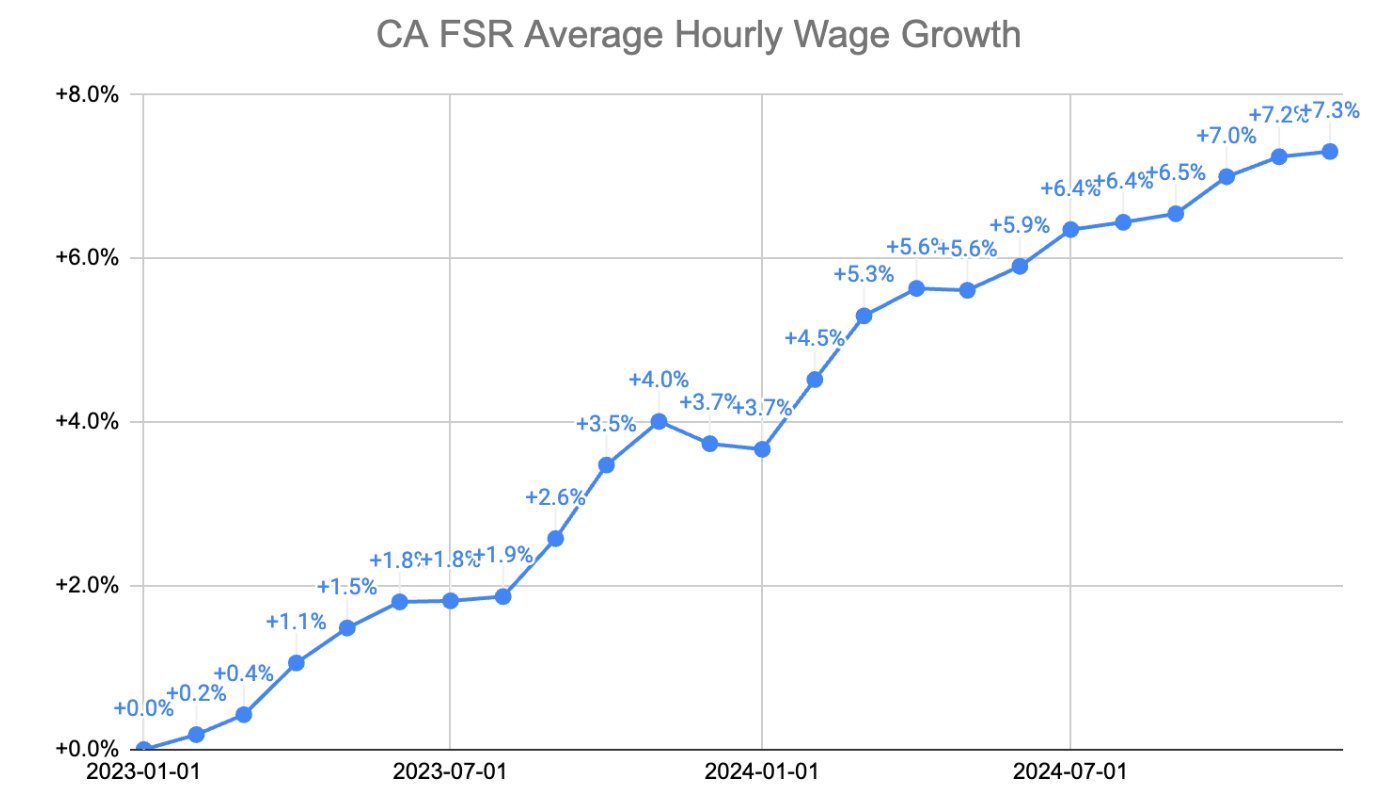
Average cheque remains level, even as wages see steady growth
Canadians’ shrinking appetites for dining out will increase pressure on an industry already grappling with economic uncertainty and rising food costs.
For full-service restaurants using Square, average cheque amounts have remained relatively flat over the past two years, from $51.64 in December 2022 to $52.98 in December 2024, which amounts to a decrease when adjusted for inflation.
At the same time, hourly wages for full-service restaurant workers using Square have seen steady growth, increasing 7.74% from a national average of $16.27 to $17.53 between December 2022 and December 2024.
According to Square’s recent Future of Commerce Report, in order to manage costs, 69% of Canadian restaurant operators plan to raise prices in 2025, while 89% are planning to invest in automation technology and AI to improve their businesses this year, and create operational efficiencies.
“Despite inflation easing, restaurants in Canada are continuing to face a number of challenges in their operations, whether it’s fluctuating food prices, employee retention, or ballooning payroll costs. Many restaurants are grappling with how to balance these increased expenses while still offering affordability to customers. We’ve seen some restaurants lean on automation and other time-saving technology to keep margins under control,” said Ming-Tai Huh, Head of Food and Beverage at Square.
For more information about how Square’s integrated ecosystem of commerce products can help restaurants start, run and grow, visit https://squareup.com/ca/en/point-of-sale/restaurants.
Methodology:
The consumer survey was conducted by Leger from February 7 to 9, 2025 with 1,590 adults in Canada. No margin of error can be associated with a non-probability sample (i.e., a web panel in this case). For comparative purposes, a probability sample of n=1,590 respondents would have a margin of error of ±2.5%, 19 times out of 20. Incidence weighting was completed by gender, age, region, education, and language, based on Statistics Canada data.