View your team’s appointment performance report
About appointments performance reporting
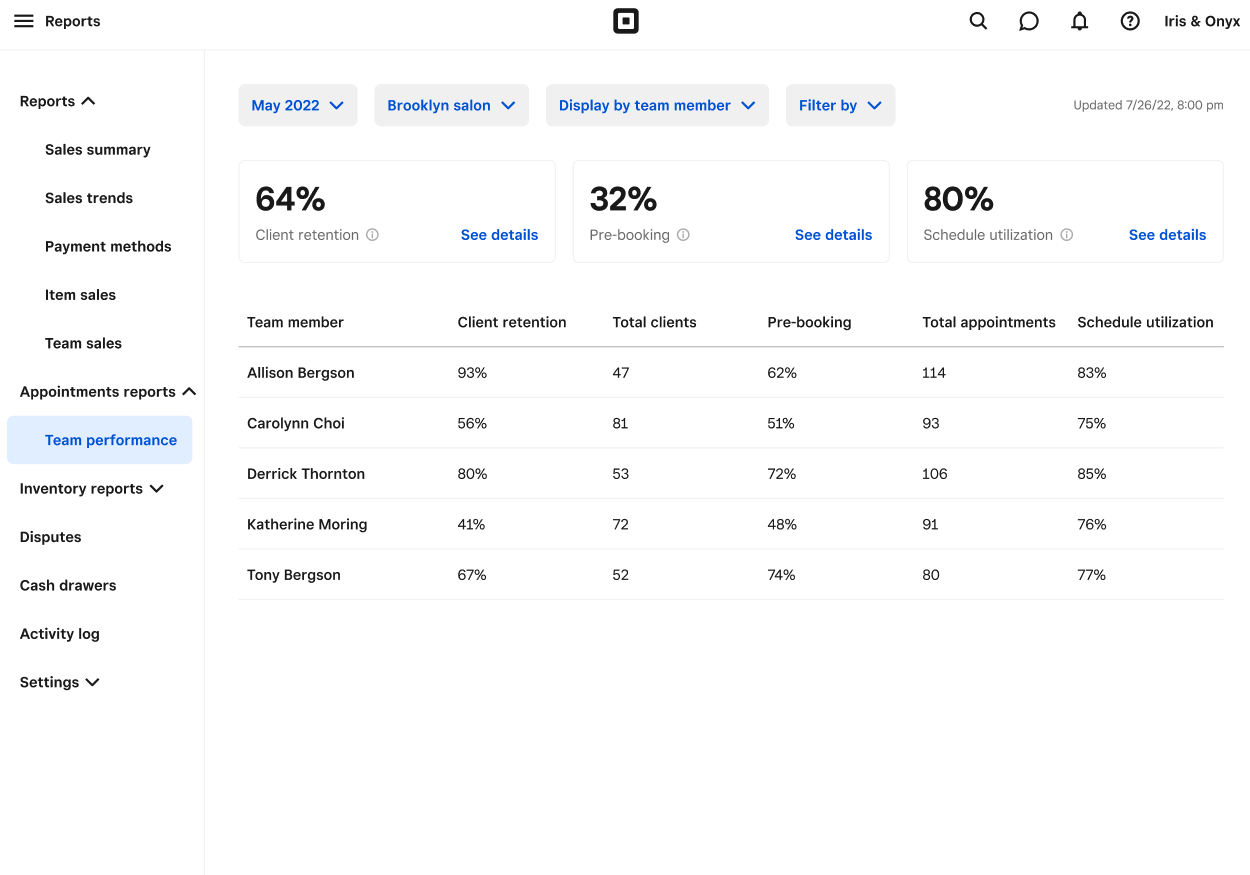
The Square Appointments team performance report allows you to measure your team member or business performance, whether you manage a team or you’re a sole trader. You can see real-time performance metrics for retention and pre-booking and review schedule utilisation.
Before you begin
A team performance report includes the following metrics. These metrics only include appointments that aren’t cancelled or marked as no-show.
Client retention: A ratio defined as the number of returning clients divided by the number of total clients. A return client is defined as a client that visited within a year before the date range. Total clients is the number of clients that had a visit in a date range.
Pre-booking: A ratio defined as the number of visits when the client pre-booked, divided by their total number of visits. To qualify as a pre-booking, a client must book at least one future appointment within 24 hours of their current appointment end time.
Schedule utilisation: The percentage of total working hours (total available hours) for your staff that are booked by clients (booked hours). This reporting metric helps determine if you are overstaffing or understaffing your business as well as gauge staff performance.
Recurring appointments are not yet supported in metric calculations and are only included in calculations once they are paid or edited, not rescheduled or service/team member change.
View team performance report
Sign in to Square Dashboard and go to Reports > Operations > Team performance.
Filter by date range, location, team member or service to view overall metrics.
Select See details next to Client retention, Pre-booking or Schedule utilisation percentages to see additional staff metrics and reporting details.
The maximum date range for a team performance report is one year. When filtering by location, team member or service, metrics will only calculate based on appointments that match those filters. The filter Display by service or team member will not show rows for services or team members when there are no appointments that match the selected service or team filter.