Download and customise the Square Dashboard app
About the Square Dashboard app
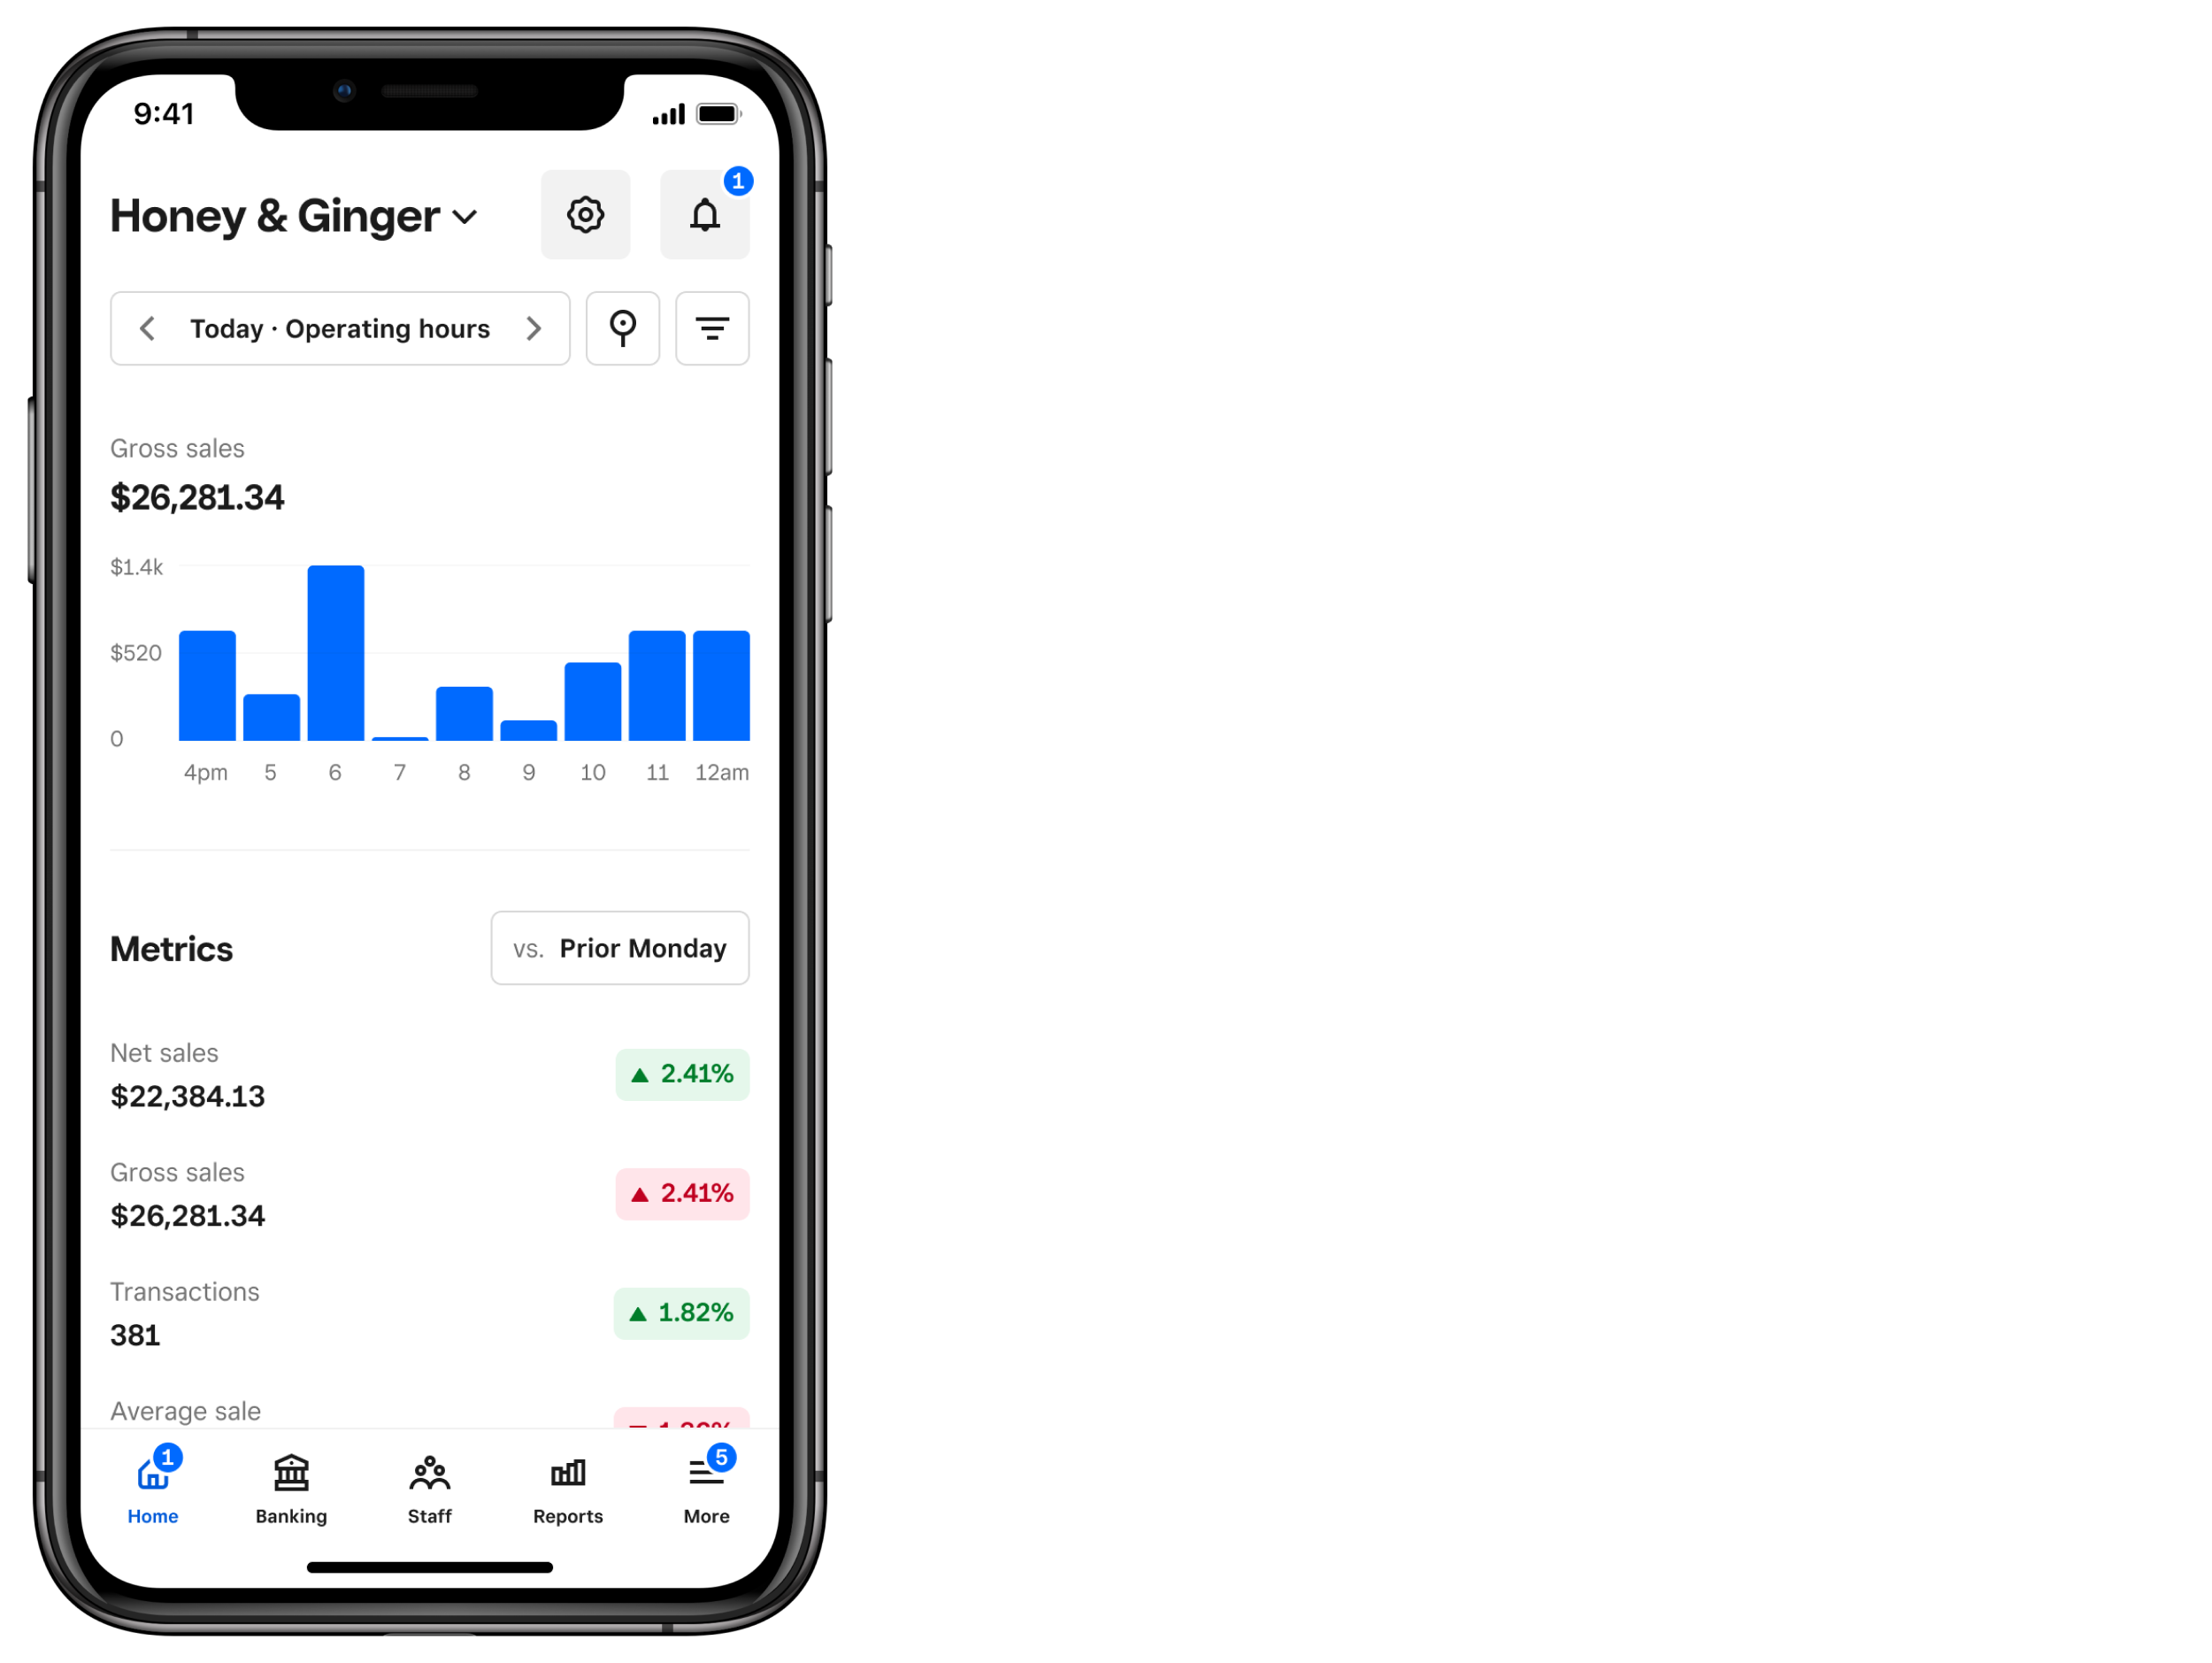
The Square Dashboard app provides a unified and customisable look at your business. You can track your business performance, configure your reporting hours, manage labour performance, monitor finances and manage your team all from your mobile phone.

Before you start
The Square Dashboard app is compatible with iOS and Android devices, but widgets are only available on iOS devices.
If you have multiple Square accounts, sign in to the app with the email address and password associated with your primary account. Tap the location pin icon to filter your data between your locations or filter for multiple locations at the same time.
Some features of the Dashboard app aren’t available depending on permissions. Set permissions in Square Dashboard using a web browser.
Set up widgets on iOS devices
You can easily access statistics and data about your business with the Dashboard app widget. You can view your gross sales, net sales, transactions and average sale from your home screen. You can also customise the data timeframe.
To Add, edit and remove widgets on iPhone:
- Go to the home screen on your iOS device.
- Touch and hold the Home Screen background until the apps start to jiggle.
- Tap Edit > Add Widget.
- In the widget search bar, type ‘Dashboard’ or scroll to locate the app.
- Tap Dashboard then swipe left or right to select the widget style. You have the option to show:
- Data point to view a single data point,
- Key info to view your most important data points, or
- Up next to keep track of your upcoming shifts.
- When you see the widget view you want, tap Add Widget.
- Drag and drop the widget to the desired location on your home screen.
- Tap Done.
- Tap and hold the widget on your iOS device.
- Select Edit Widget.
- To adjust the time period, select Time Period and select your preferred time range.
- To adjust which metrics you see, tap Metrics. If you have the larger version of the widget that shows multiple metric options, select the name of each metric to adjust the view.
- To rearrange the order of the metrics in the list, tap and drag the three horizontal lines (≡) next to each metric to the desired location.
Customise your app tabs
You can display up to four tools to the main menu for instant access. To do so:
Open the Square Dashboard app and select More > Customise.
Under More, select (+) next to the pages you want to display on the bottom navigation bar.
Under Main menu, select (-) next to the options you want to remove.
Tap Save.
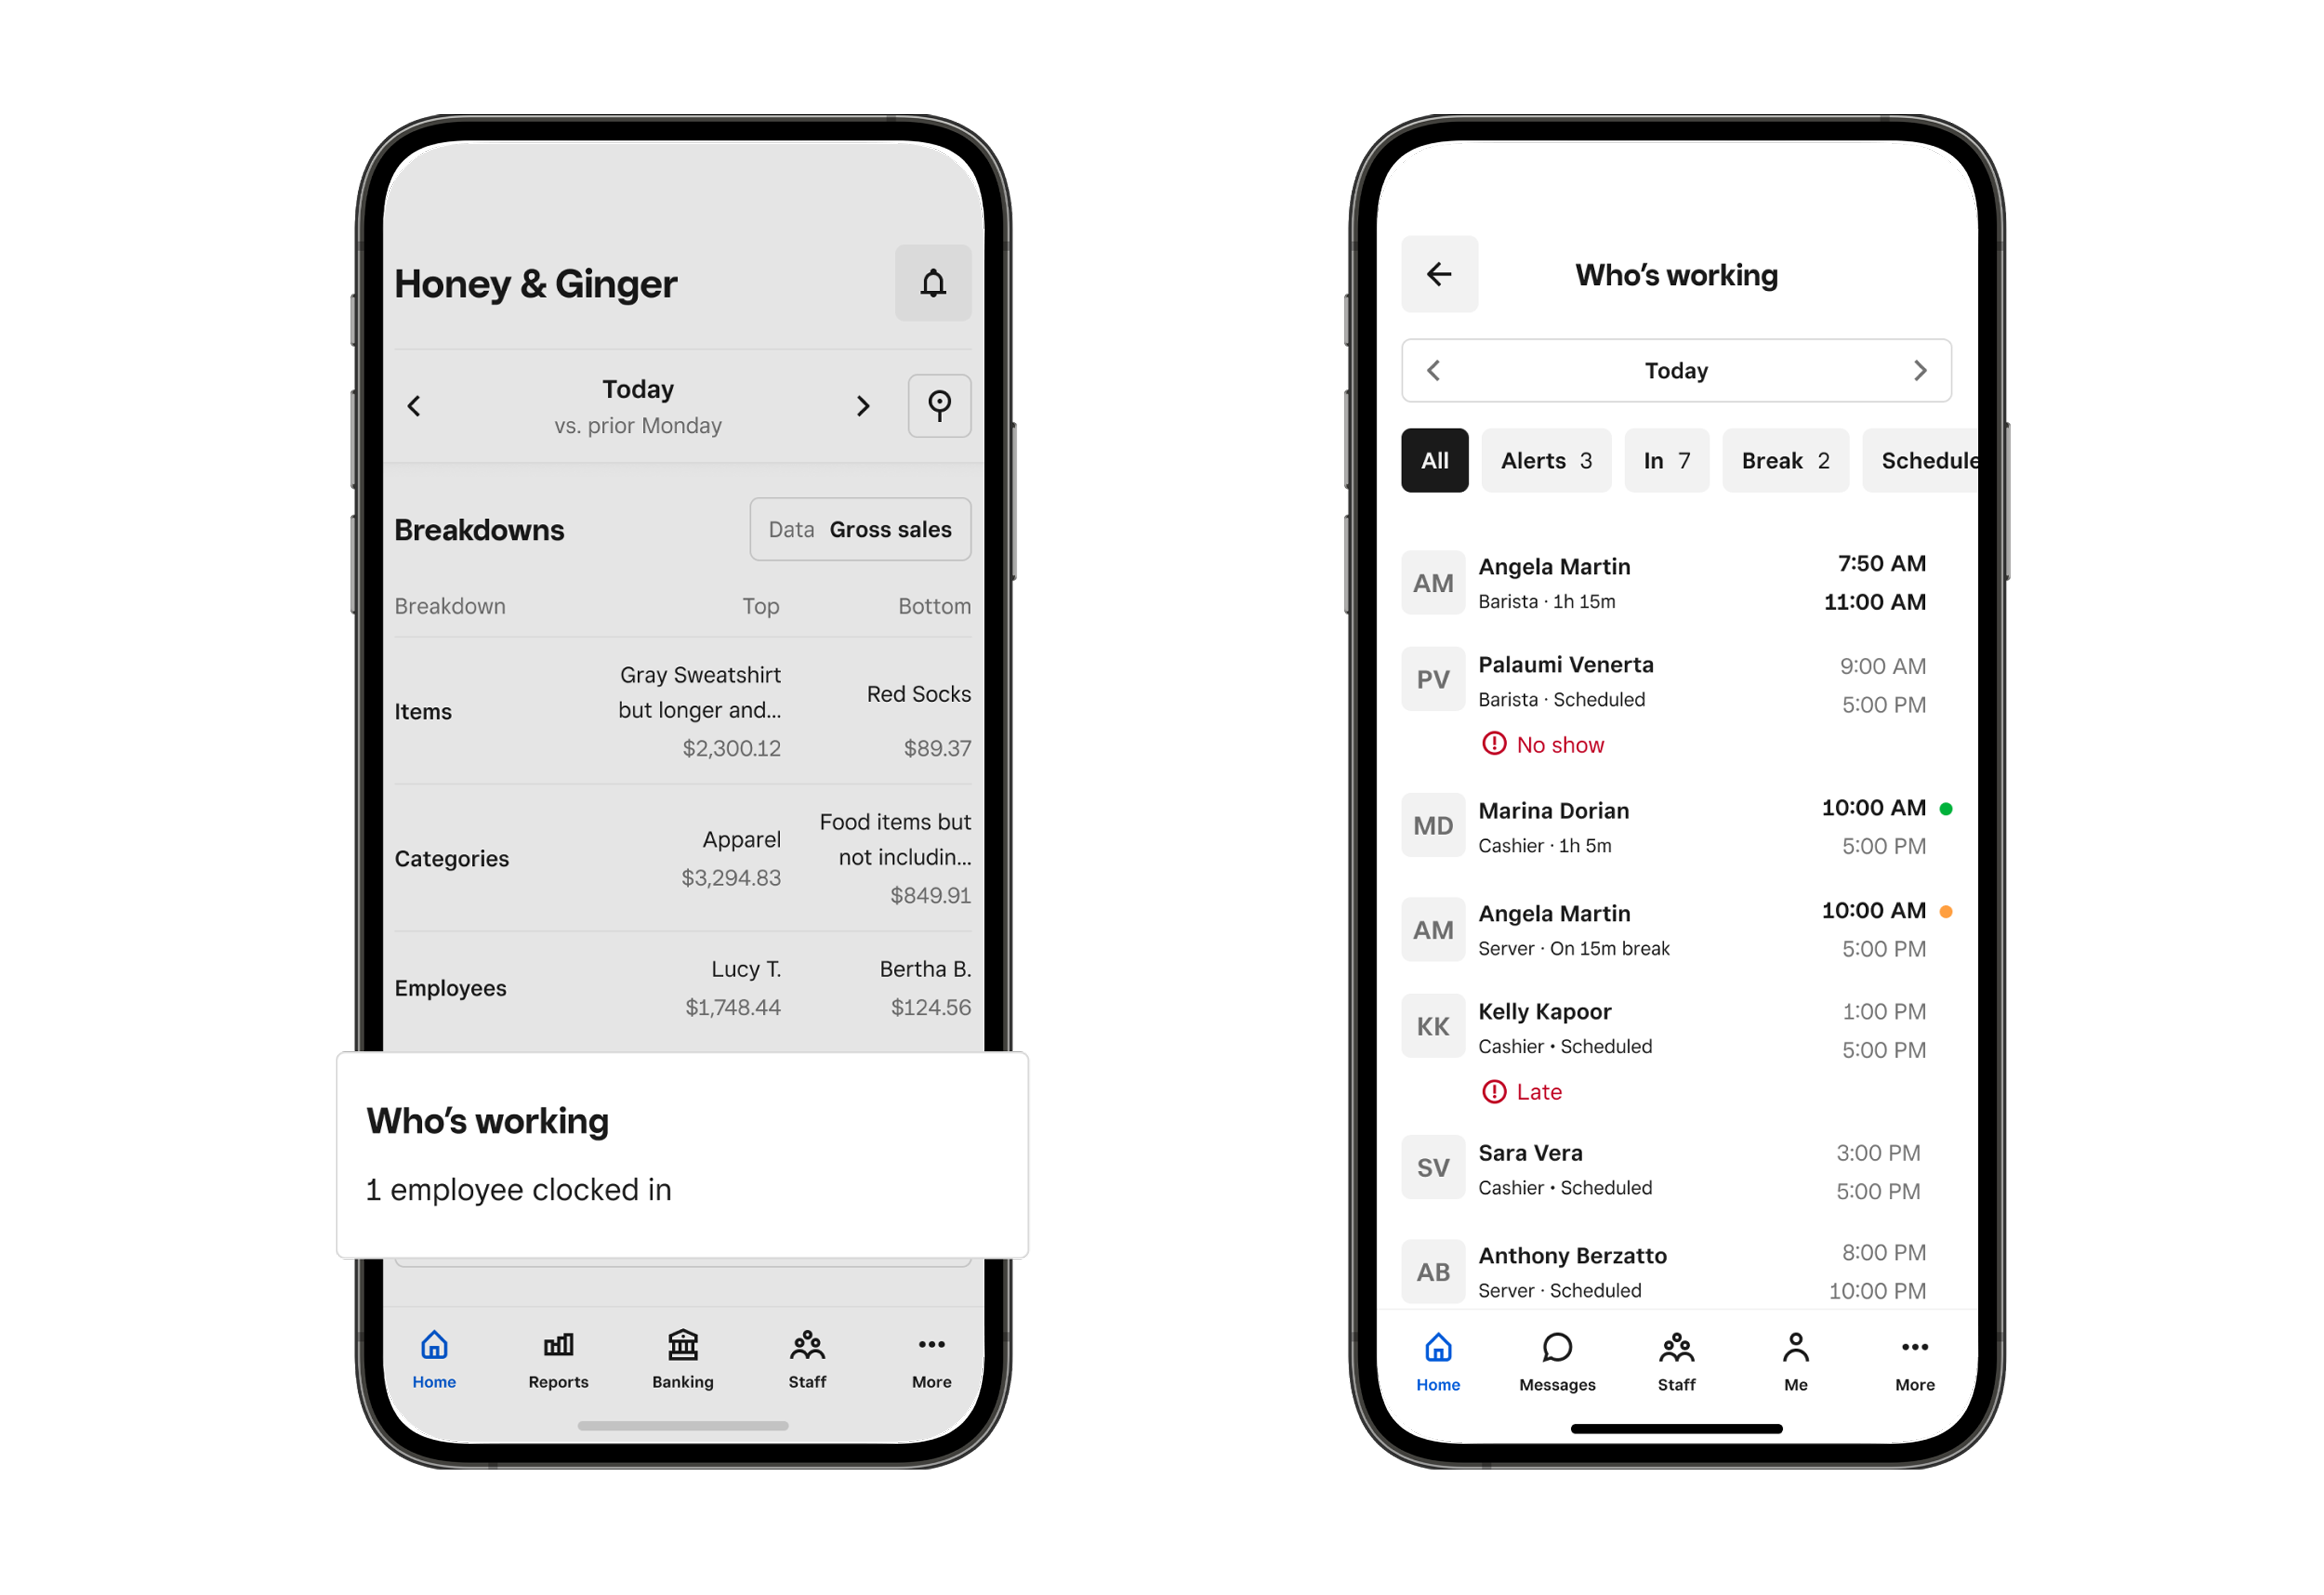
Who’s working widget
The date picker defaults to the current day. To select a different date, open the calendar by selecting the date picker.
Filter by status to see team members who are clocked in/out, on a break, scheduled, or have alerts.
View multi-location details including team members, their schedules, and current statuses.
