

Table des matières
En tant que propriétaire d’entreprise, vous prenez des décisions cruciales chaque jour. Et c’est plus facile de prendre de bonnes décisions quand vous avez la bonne information, juste au bout des doigts.
C’est là que les outils d’analyse commerciale interviennent. Ils vous permettent de prédire les résultats et de tenir compte des risques associés aux différentes options de sorte que vous puissiez faire un choix plus judicieux.
Voyons cela de plus près.
Qu’est-ce que les analyses commerciales?
L’analyse commerciale est la possibilité de transformer l’information en données utiles qui vous aideront à améliorer votre mode de gestion. Les analyses vous aident à mieux comprendre ce qui fonctionne bien et ce qui ne fonctionne pas, de sorte que vous puissiez élaborer des stratégies de croissance.

À quoi cela ressemble-t-il concrètement? Disons que vous effectuez un suivi de vos ventes quotidiennes avec un outil d’analyse et que vous constatez que vos journées les plus occupées sont les samedis, les dimanches et les lundis en milieu d’avant-midi et en début de soirée (voir ci-dessous). Cela pourrait vous indiquer combien d’employés affecter durant ces heures, à établir votre horaire et même à gérer vos stocks.
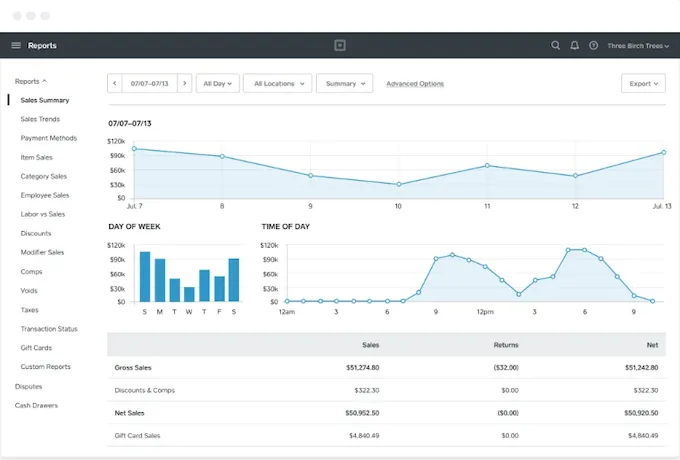
Ainsi donc, plus il y a de données, et plus les outils facilitent votre analyse et votre compréhension de la situation, plus il vous devient facile de prendre des décisions.
(Si vous faites des recherches sur les différents types d’outils d’analyse, vous pourriez voir le terme « veille commerciale ». Quelle est la différence entre les analyses commerciales et la veille commerciale? La veille commerciale est la catégorie sur laquelle repose les analyses commerciales.)
Renseignez-vous sur les outils d’analyse intégrés de la Solution PDV Square.
Quatre types d’outils d’analyse pour petites entreprises
Les outils d’analyse commerciale peuvent changer la donne pour votre entreprise, surtout si vous êtes en phase de démarrage. Ils vous éclaireront sur ce que vous vendez, comment, à qui et quand vous vendez, sur ce que cela représente pour votre marque et tout ce qui l’entoure, de près ou de loin.
Voici quelques options d’analyse dont votre arsenal de propriétaire d’entreprise devrait disposer.
-
Analyses Web
Les outils d’analyse Web vous indiquent combien de personnes ont visité votre site, comment ils y accèdent et ce qu’ils y font une fois qu’ils y sont. Si vous avez une boutique en ligne, comprendre comment vos clients interagissent avec votre site est essentiel au maintien et à la croissance des ventes. L’outil Google Analytics est gratuit et un des outils les plus souvent utilisés, bien que le créateur de votre site Web puisse également intégrer des outils d’analyse de haut niveau. -
Analyses des médias sociaux
Si une partie quelconque de votre marketing se trouve sur les médias sociaux, il est important de comprendre comment les gens adoptent votre contenu. Chaque plateforme dispose de son propre outil d’analyse native, qui fournit de nombreux détails. Des outils tels que HootSuite ou Buffer fournissent une vue consolidée de vos comptes. -
Analyses du point de vente
Les analyses de votre point de vente intègrent toutes vos transactions dans des rapports faciles à comprendre et sur lesquels vous pouvez agir. La Solution PDV Square vous permet de voir les tendances des ventes sur certaines périodes par produit, par catégorie, par point de vente et même par employé. -
Analyses des clients
Un outil de gestion des relations clients vous permet de stocker l’information des clients de sorte que vous puissiez communiquer avec eux. Et vous devriez être en mesure de trouver de l’information au sujet de vos clients à partir de ces communications et de vos activités de marketing. Vous pourriez par exemple savoir quels types de courriel il est probable qu’ils ouvrent. Si votre système de gestion des clients est intégré à votre point de vente, ou si votre point de vente comporte un répertoire de clients comme celui de Square, alors vous pouvez également dresser un portrait de leurs habitudes d’achat. La Solution PDV Square vous permet de déceler les nouveaux clients et les clients qui reviennent, ainsi que la dépense moyenne par client.
Comment sélectionner les outils d’analyse commerciale : six questions à poser
Lorsque vous faites le choix des outils appropriés pour votre entreprise, vous voulez utiliser les mêmes critères de sélection que pour l’évaluation des possibilités. Cela ne signifie pas que vous utiliserez les mêmes critères pour évaluer les outils de médias sociaux que vous le feriez pour les analyses Web. Mais vous devriez poser les mêmes questions à tous les fournisseurs que vous évaluez dans une même catégorie.
Commencez par préparer une liste de tous les fournisseurs pour chaque type d’outil d’analyse, puis posez quelques questions :
- Quel est mon objectif en me procurant cet outil? Quelles sont les informations précises que je voudrais en tirer?
- Quel est le coût? Ou mieux encore, quel est le rendement du capital investi? Y a-t-il des frais mensuels et les frais sont-ils imputés par utilisateur? Puis-je faire un essai gratuit pour commencer?
- L’outil est-il facile à utiliser? Quels sont les délais d’apprentissage et de formation des employés?
- Où mes données sont-elles stockées? Comment puis-je y accéder? Dois-je utiliser un ordinateur de bureau ou puis-je avoir un accès mobile?
- L’intégration avec d’autres outils que j’utilisent déjà est-elle possible?
- Si l’outil me convient, est-ce qu’il évolue en fonction de la croissance de mon entreprise et si oui, comment?
Lorsque vous aurez déterminé quel outil d’analyse convient à vos besoins, alors le coût et la facilité d’utilisation sont les facteurs les plus importants à considérer. Les options d’analyse à faible coût sont nombreuses (la Solution PDV Square est gratuite et comprend les outils d’analyse). Mais les outils ne sont pas tous faciles à utiliser, alors assurez-vous de voir une démonstration du produit avant de vous le procurer.
Accéder aux outils d’analyse de Square
La Solution PDV Square est dotée d’options d’analyse et de rapports évolués vous permettant d’accéder à de l’information importante pour stimuler vos activités. Que vous soyez à la recherche d’information récente sur la tendance des ventes ou sur les stocks, la Solution PDV Square vous donne la possibilité de l’extraire directement de votre Tableau de bord Square en ligne.Démarrer avec la Solution PDV Square.
![]()