Square Q2 Restaurant Industry Report: In Post-Pandemic Era, Restaurant Spending Shifts from Friday to Saturday

New Square data sheds light on restaurant industry trends around vacation, nightlife spending
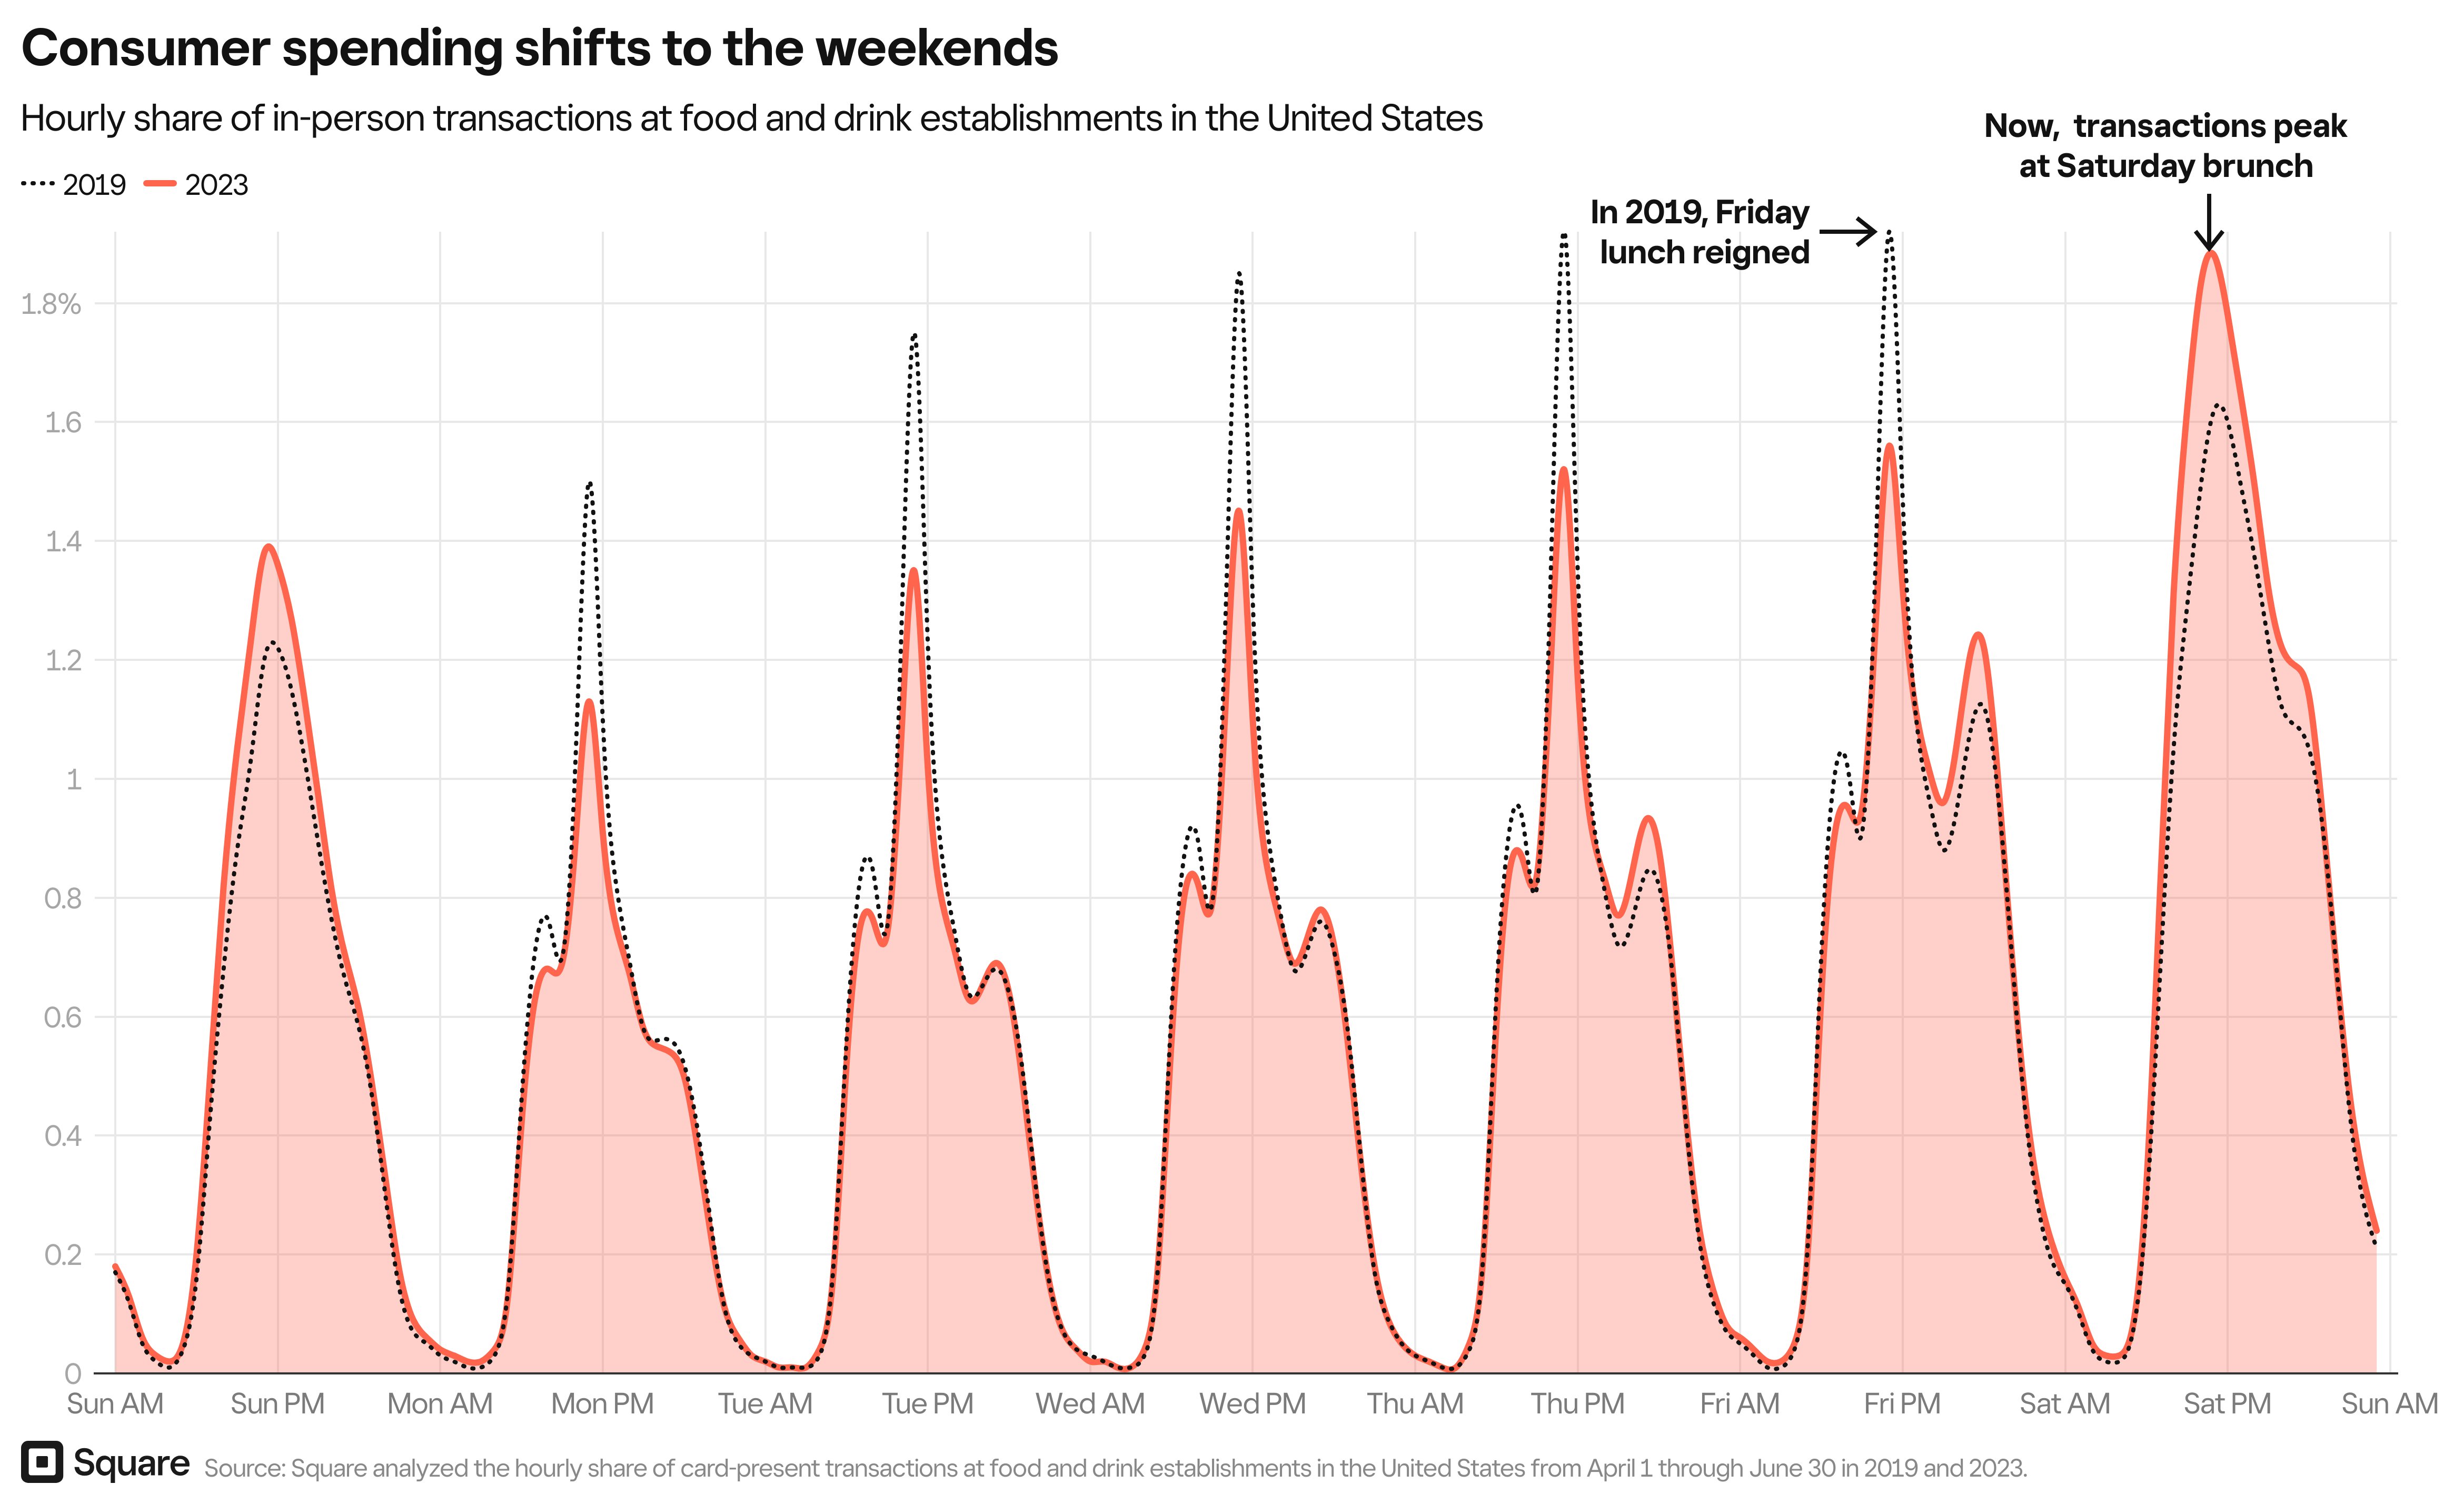
San Francisco, CA – AUG. 8, 2023 – Today, Square is introducing the inaugural edition of its quarterly Restaurant Industry Report – this report will look at data across more than 800,000 food and beverage Square sellers, examining dining trends and how consumer spending is changing. For this report, Square analyzed the hourly share of card-present transactions at food and drink establishments in the United States from April 1 through June 30 from 2019 to 2023.
With dining out, weekends are the new Friday
Consumer dining patterns have completely transformed since 2019, likely as a result of the long pause of indoor dining during the pandemic and widespread technology adoption over the past four years, particularly around delivery. Additionally, while in-person dining has rebounded tremendously, the days and times at which consumers are going out to eat has shifted.
With many companies continuing to allow remote work, people aren’t grabbing lunch by their offices or going for post-work drinks as often as they used to; instead, they’re choosing to splash out for mimosas and eggs benedict. While spending on food and beverages used to peak on Fridays at lunchtime in 2019, it’s now peaking during Saturday brunch. In 2019, Saturdays between 8am and 1pm made up 8.54% of weekly spend. In 2023, those hours now contribute 10.06% of spend.
Ming-Tai Huh, General Manager of Restaurants at Square, said the trend goes beyond a simple shift in activity. “Weekend brunch also tends to be higher-margin and produces higher per-person spend than the typical weekday lunch. These recent consumer habits are likely driving strong revenues per table for the restaurants that attract a regular brunch crowd.”
To stay on top of the brunch bustle and take advantage of business opportunity (especially due to alcohol sales), restaurants should harness technology that helps streamline their operations, turn over tables faster, and keep customers happy – with Square KDS, for example, kitchen staff can see more orders, more clearly, allowing meals to get out quickly and where they need to go.
Where do you summer? Food and beverage spending grows in top vacation destinations across the country
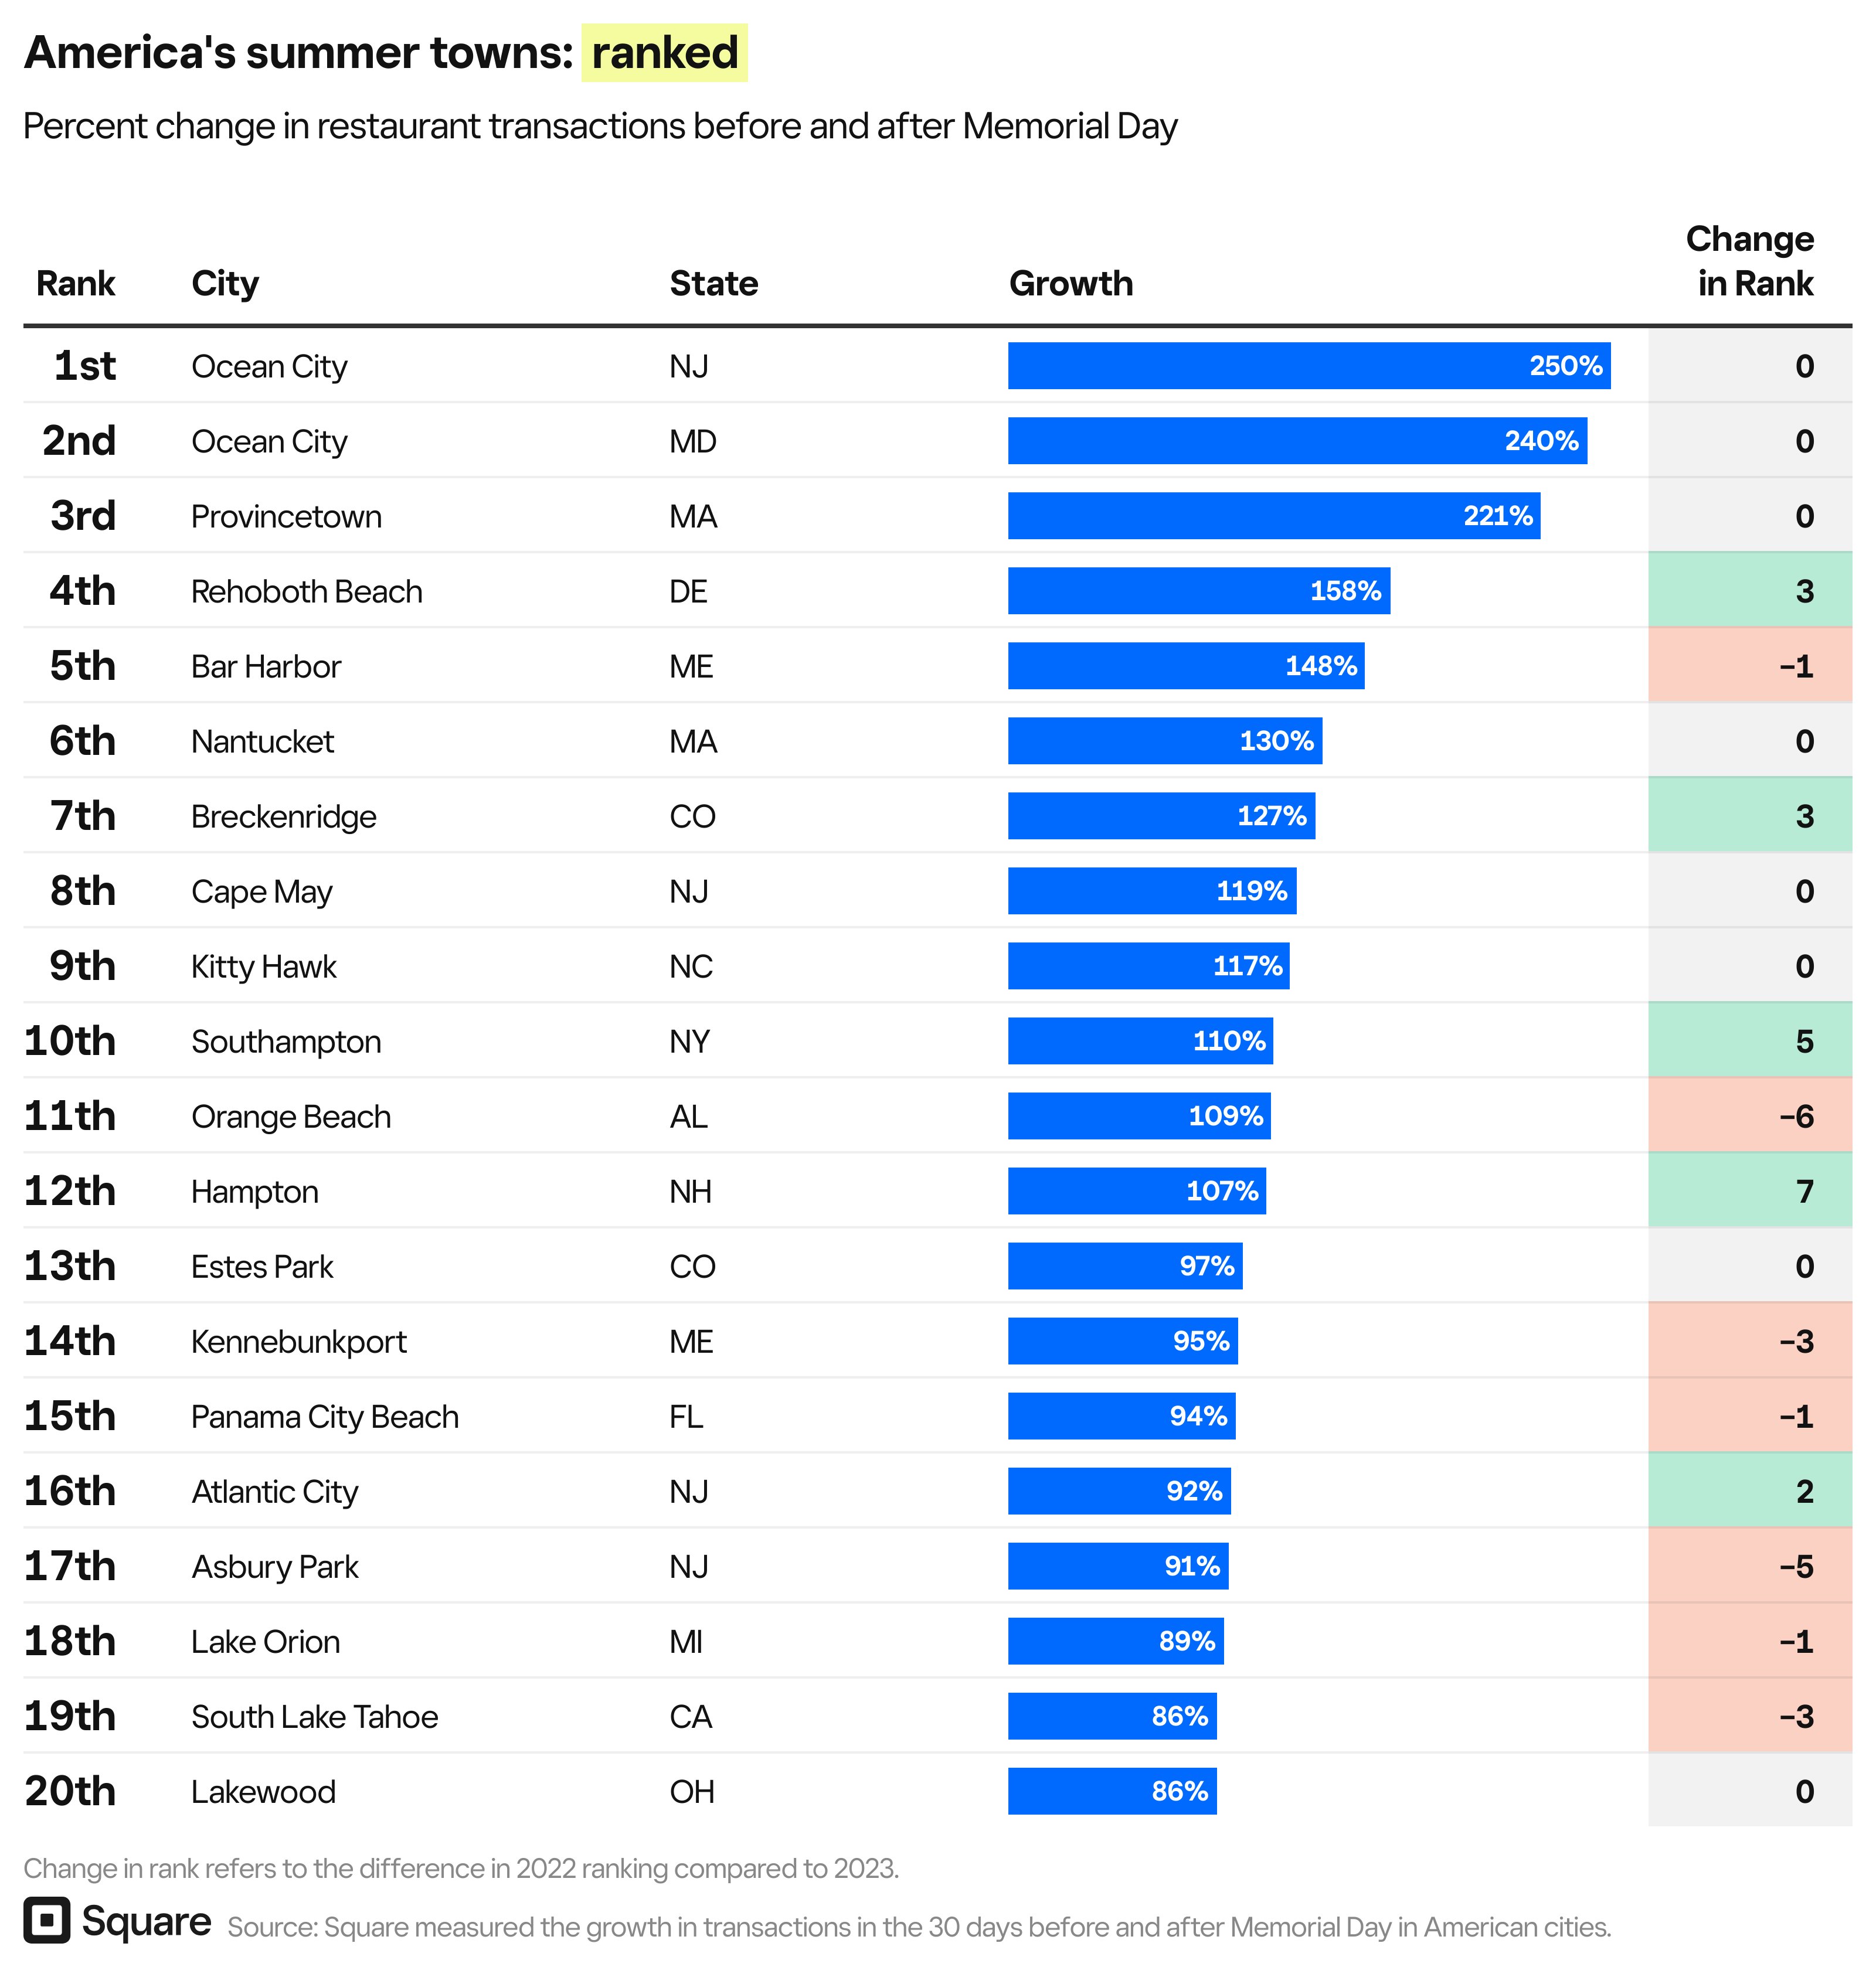
With temperatures rising and Americans headed out on vacation, consumer spending on food and beverage has increased at vacation towns across the country. When looking at transactions pre- and post-Memorial Day, towns like Ocean City, New Jersey; Ocean City, Maryland; and Provincetown, Massachusetts have seen over three-fold growth as people flock to their restaurants (250%, 240%, and 221%, respectively).
National parks are also still seeing major interest for adventurous Americans based on food and beverage spending – Bar Harbor, Maine with nearby Acadia National Park ranks fifth in spending growth (148%), and Estes Park, Colorado at the base of Rocky Mountain National Park ranks thirteenth (97%).
A few towns have seen big jumps from last year with more vacationers in need of cooling ice cream and refreshing cocktails, including Hampton, New Hampshire; Southampton, New York; Rehoboth Beach, Delaware; and Breckenridge, Colorado.
In order to keep up with the summer rush and ensure efficient staffing, restaurants can harness AI-powered tools like team management software to ensure workers can focus on the most impactful tasks and create a better customer experience.
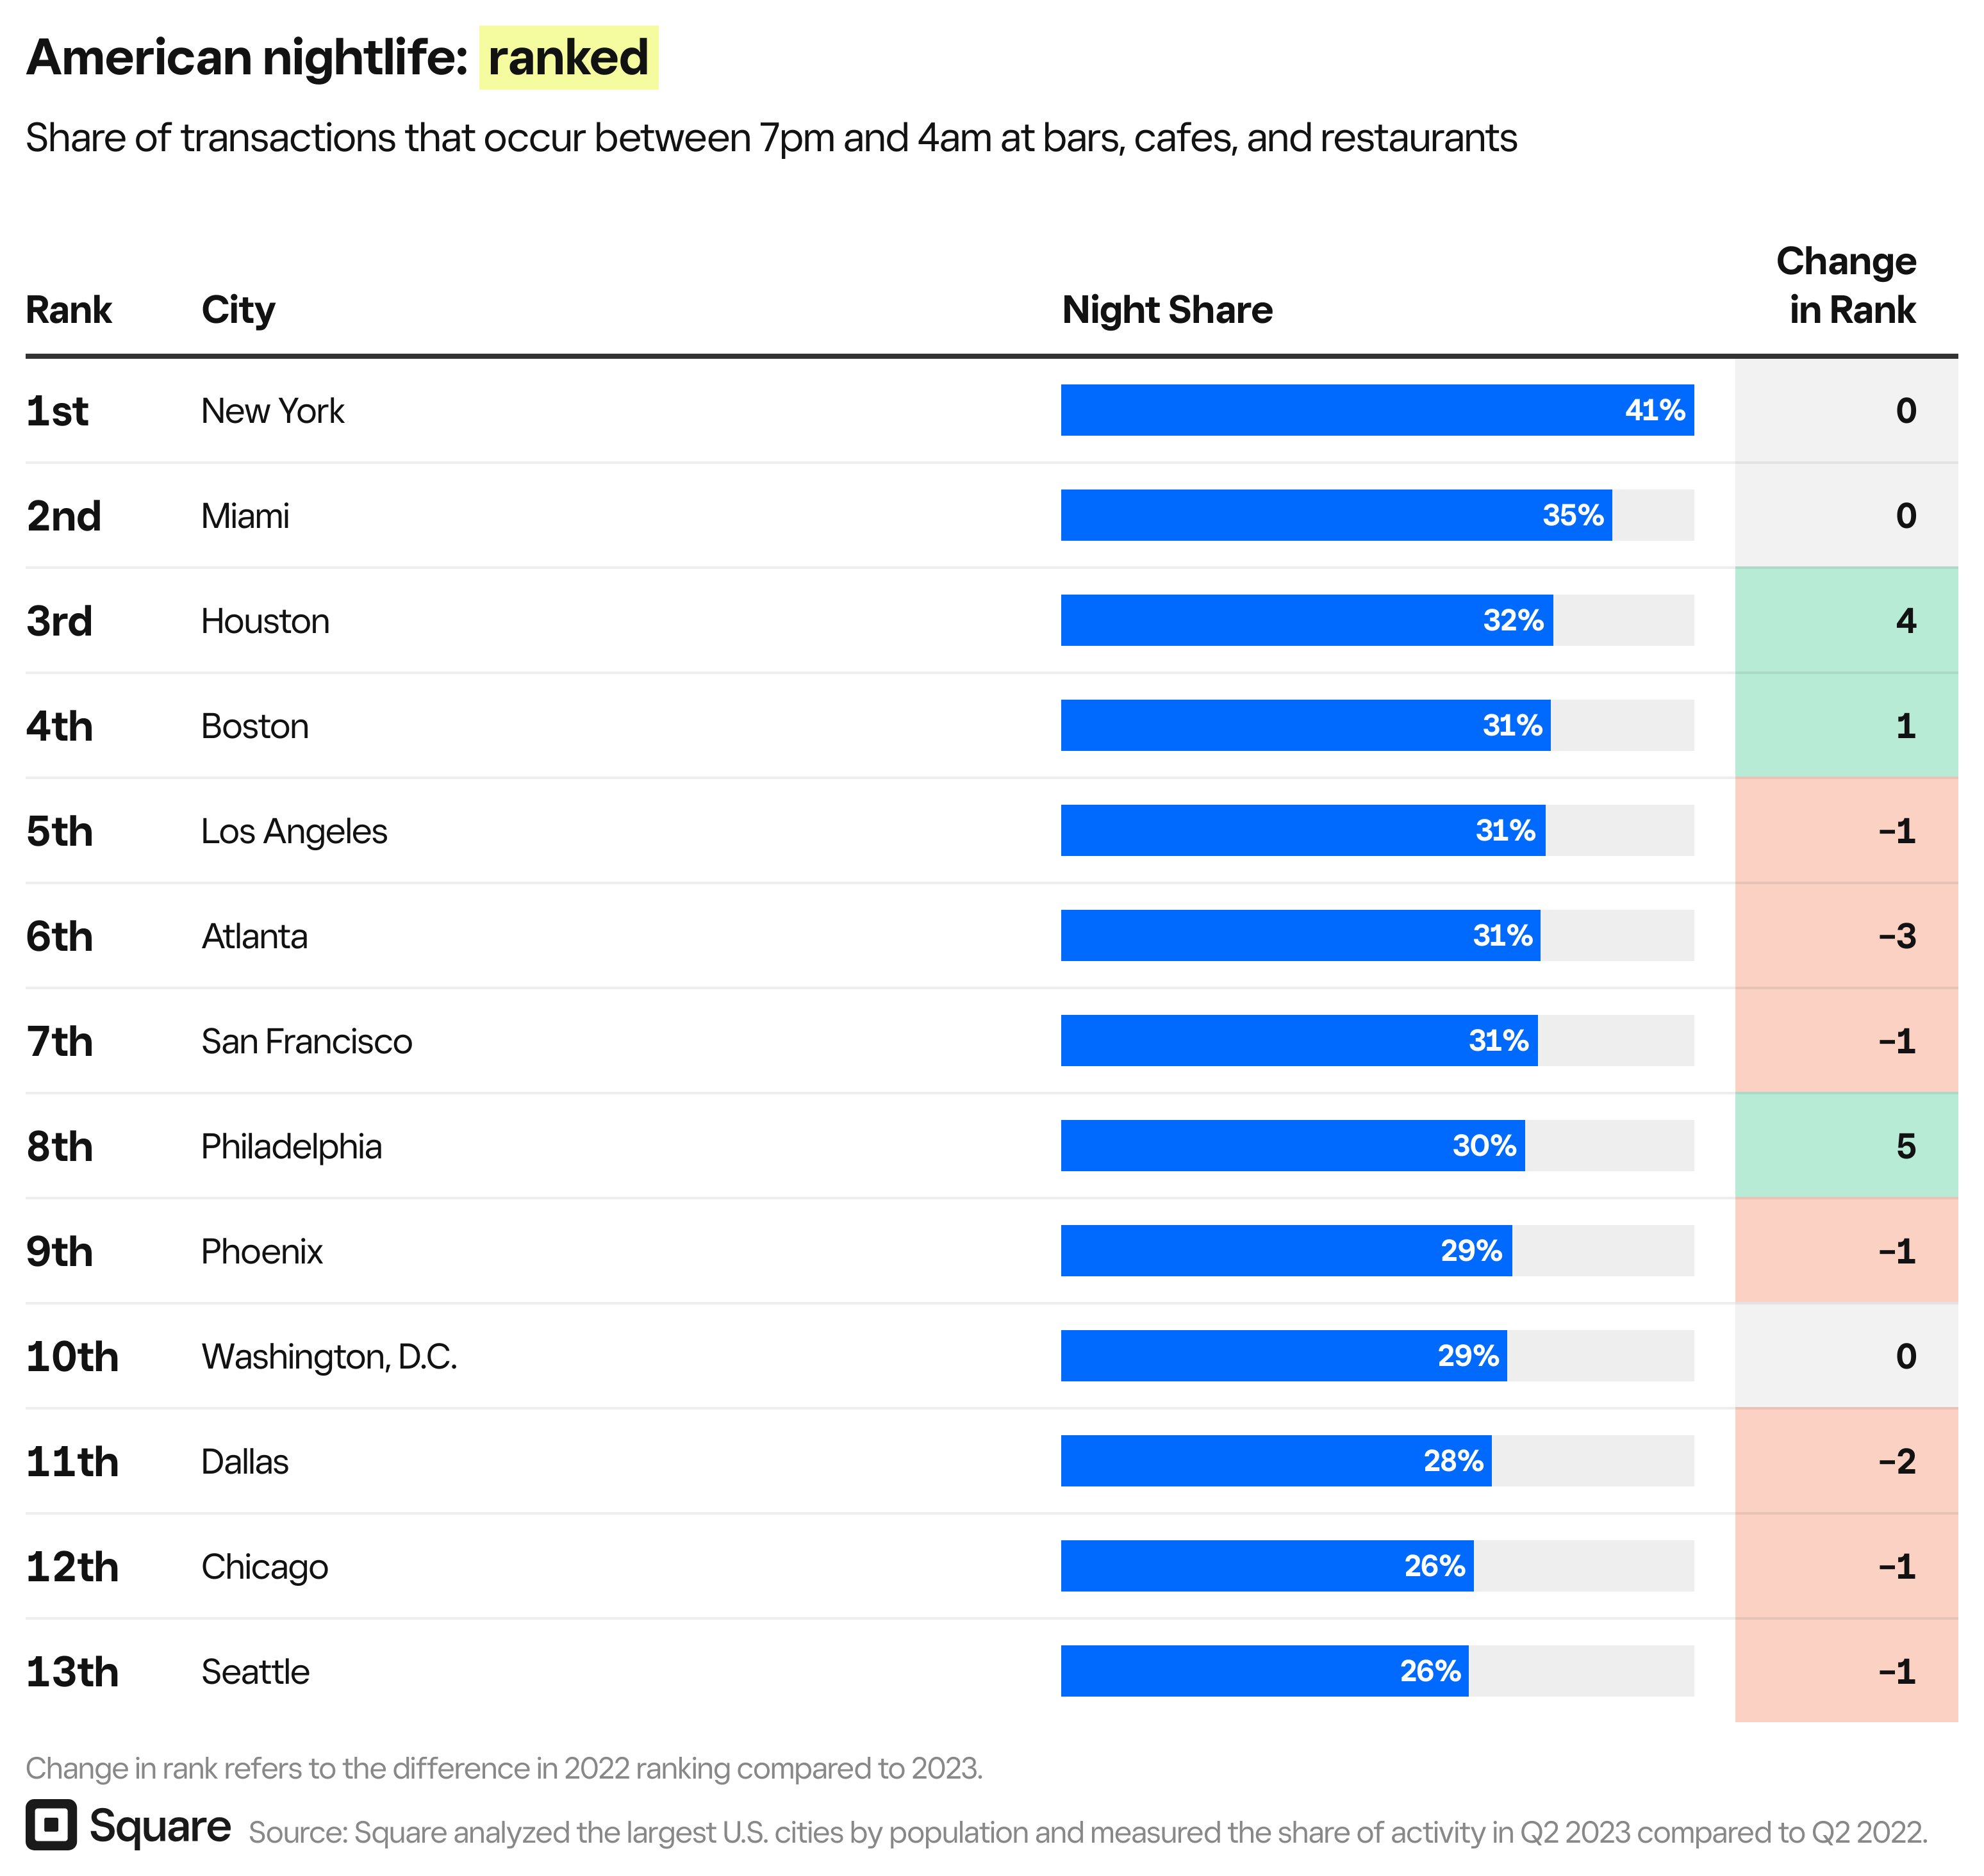
For Philadelphia, Houston, and Boston, nightlife is back in a big way
People are back out on the town as more consumers stay out later and spend more money on food and drinks. Looking at each cities’ share of transactions between 7pm and 4am at bars and restaurants, New York and Miami came out on top (with 41% and 35% respectively), while cities like Houston, Boston, and Philadelphia each secured a higher rank than in 2022 despite their bars closing at 2am.
As Americans continue going out – and staying out – restaurants and bars will need to continue investing in flexible technology that keeps orders flowing and customers happy. With Square’s Mobile POS, bars can easily bust lines and restaurants can offer quick tableside service.
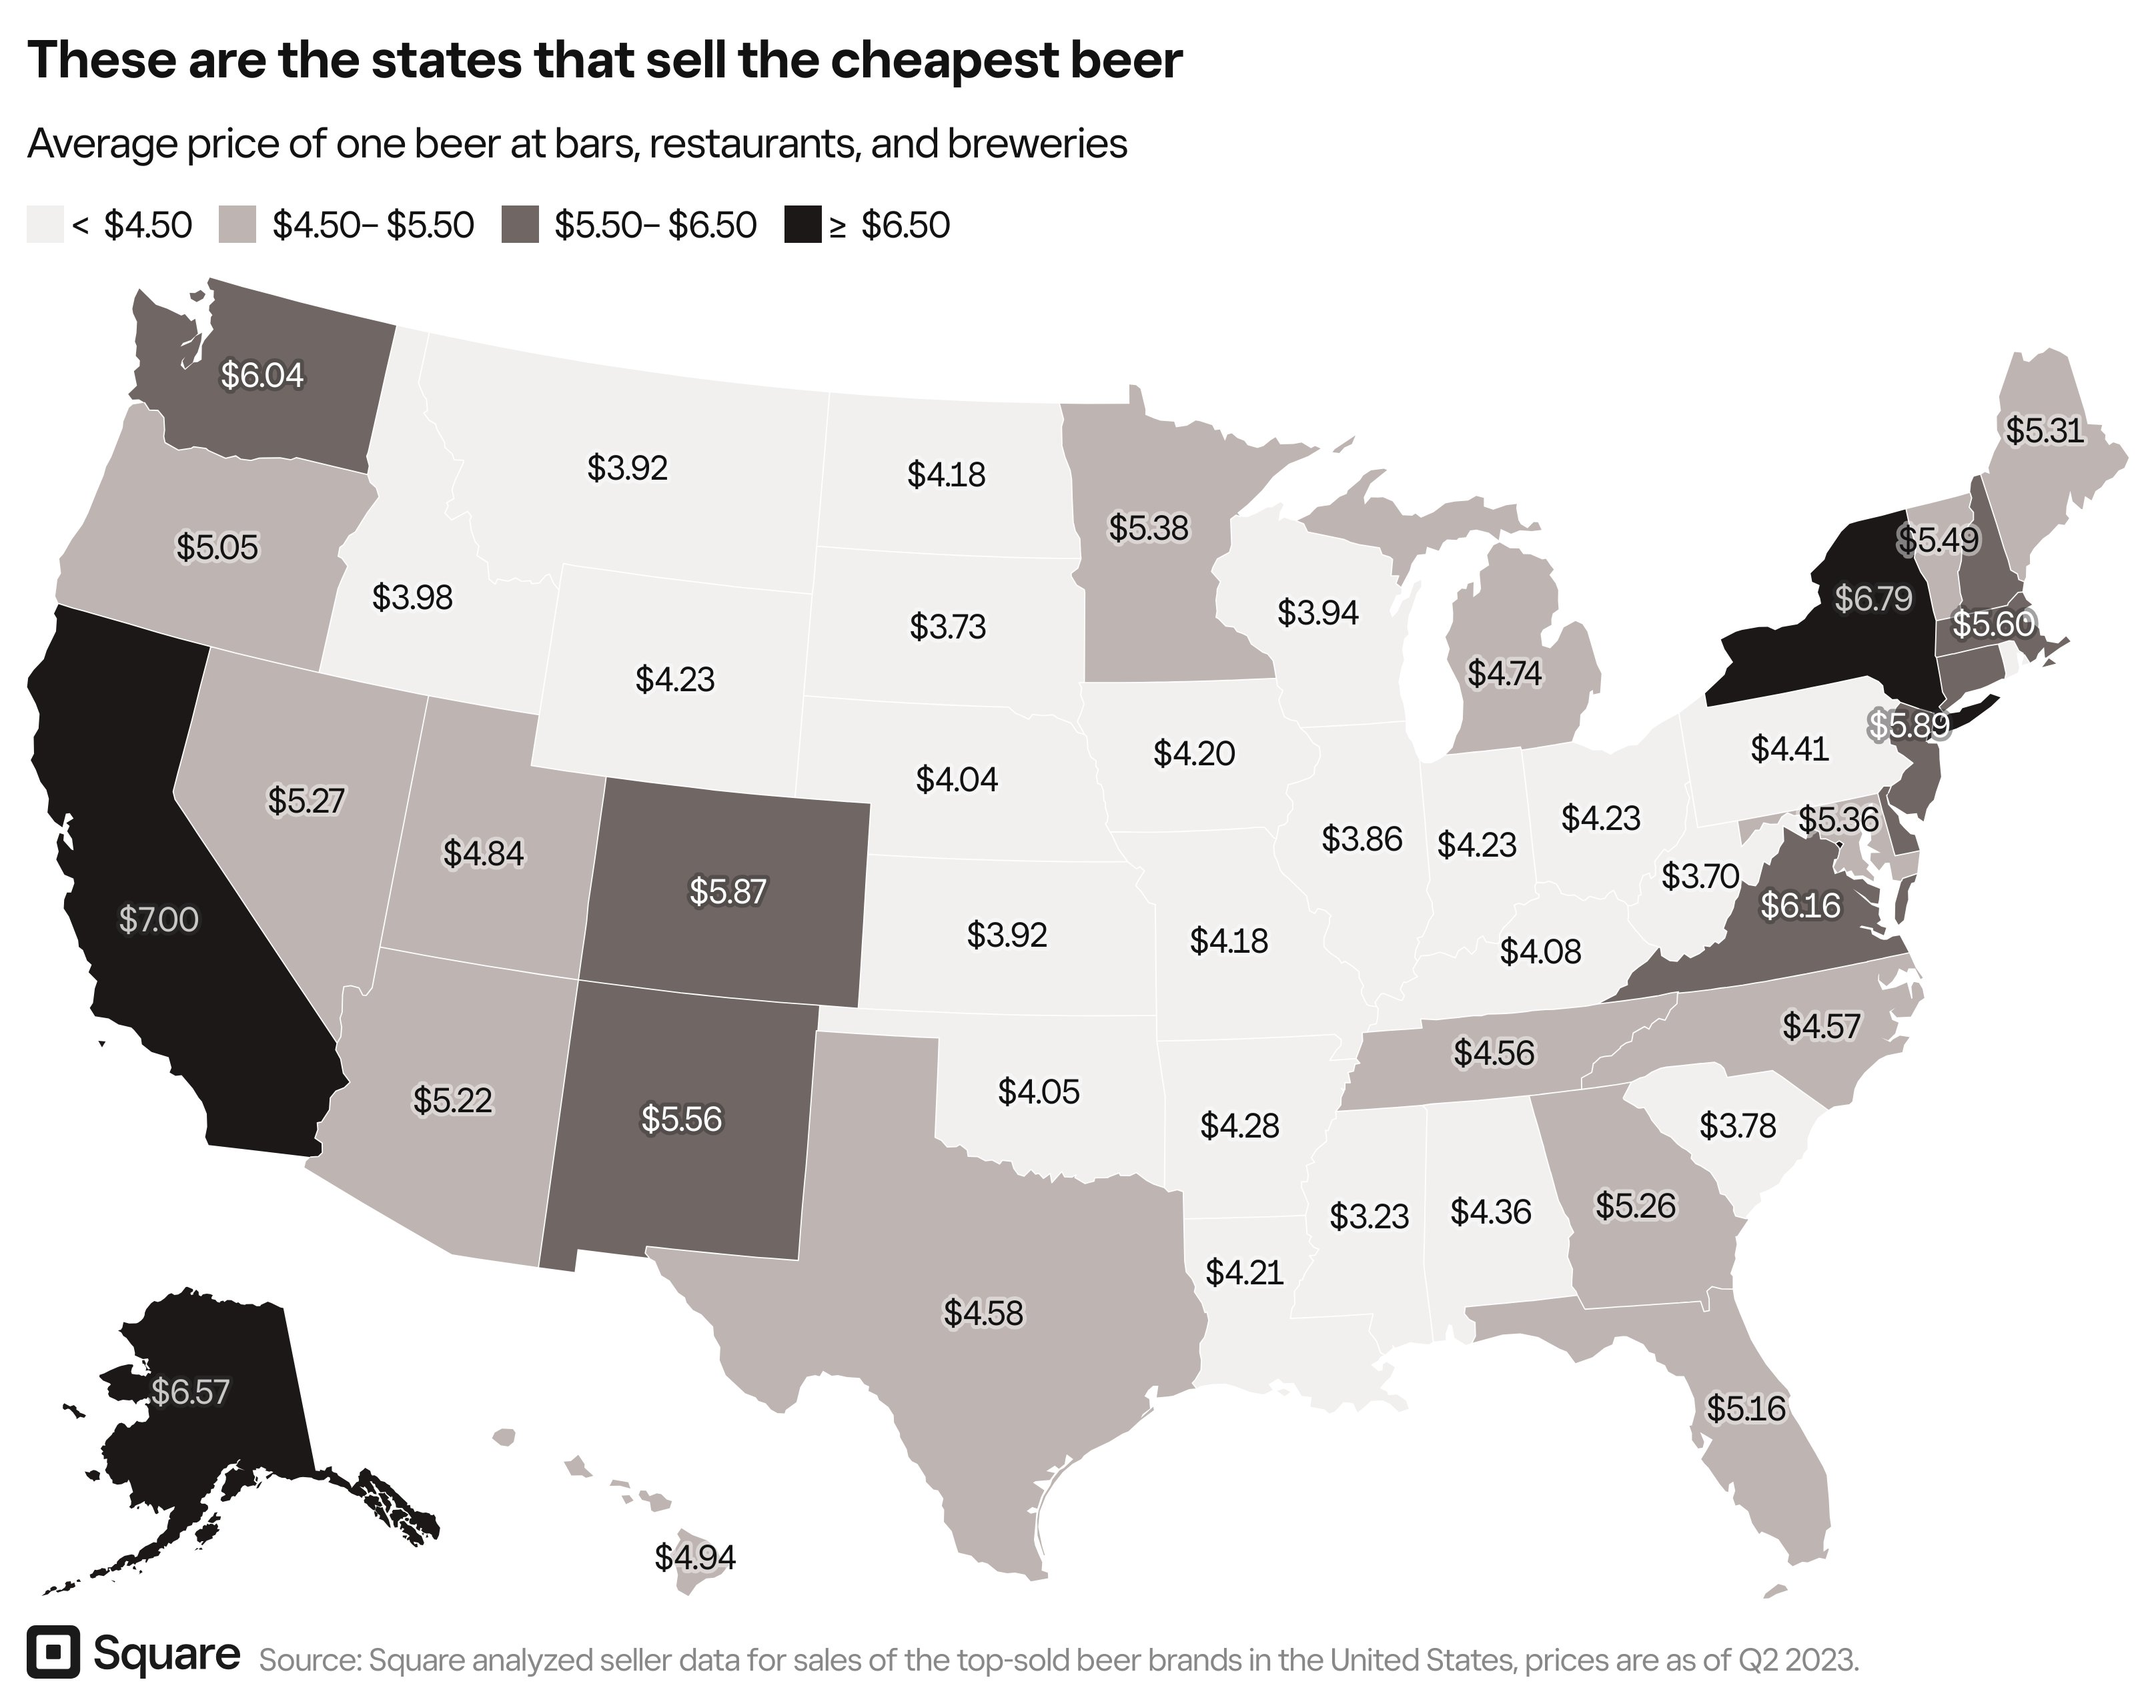
Cheers to cheap beer – here’s how much a beer costs in each state
Planning a getaway this summer? Your beer bucks will get you the most in Mississippi and the least in California. The most affordable beer can be found in the Magnolia State with an average cost of $3.23 – citizens of the Golden State, conversely, face the highest beer costs with an average of $7.00 per brew. Nationally, the average cost of a beer is $5.01.
As of 2022, 36.8% of beer sales occur between May and August, and July is the most popular month for beer with 9.5% of beer sales occurring in July.
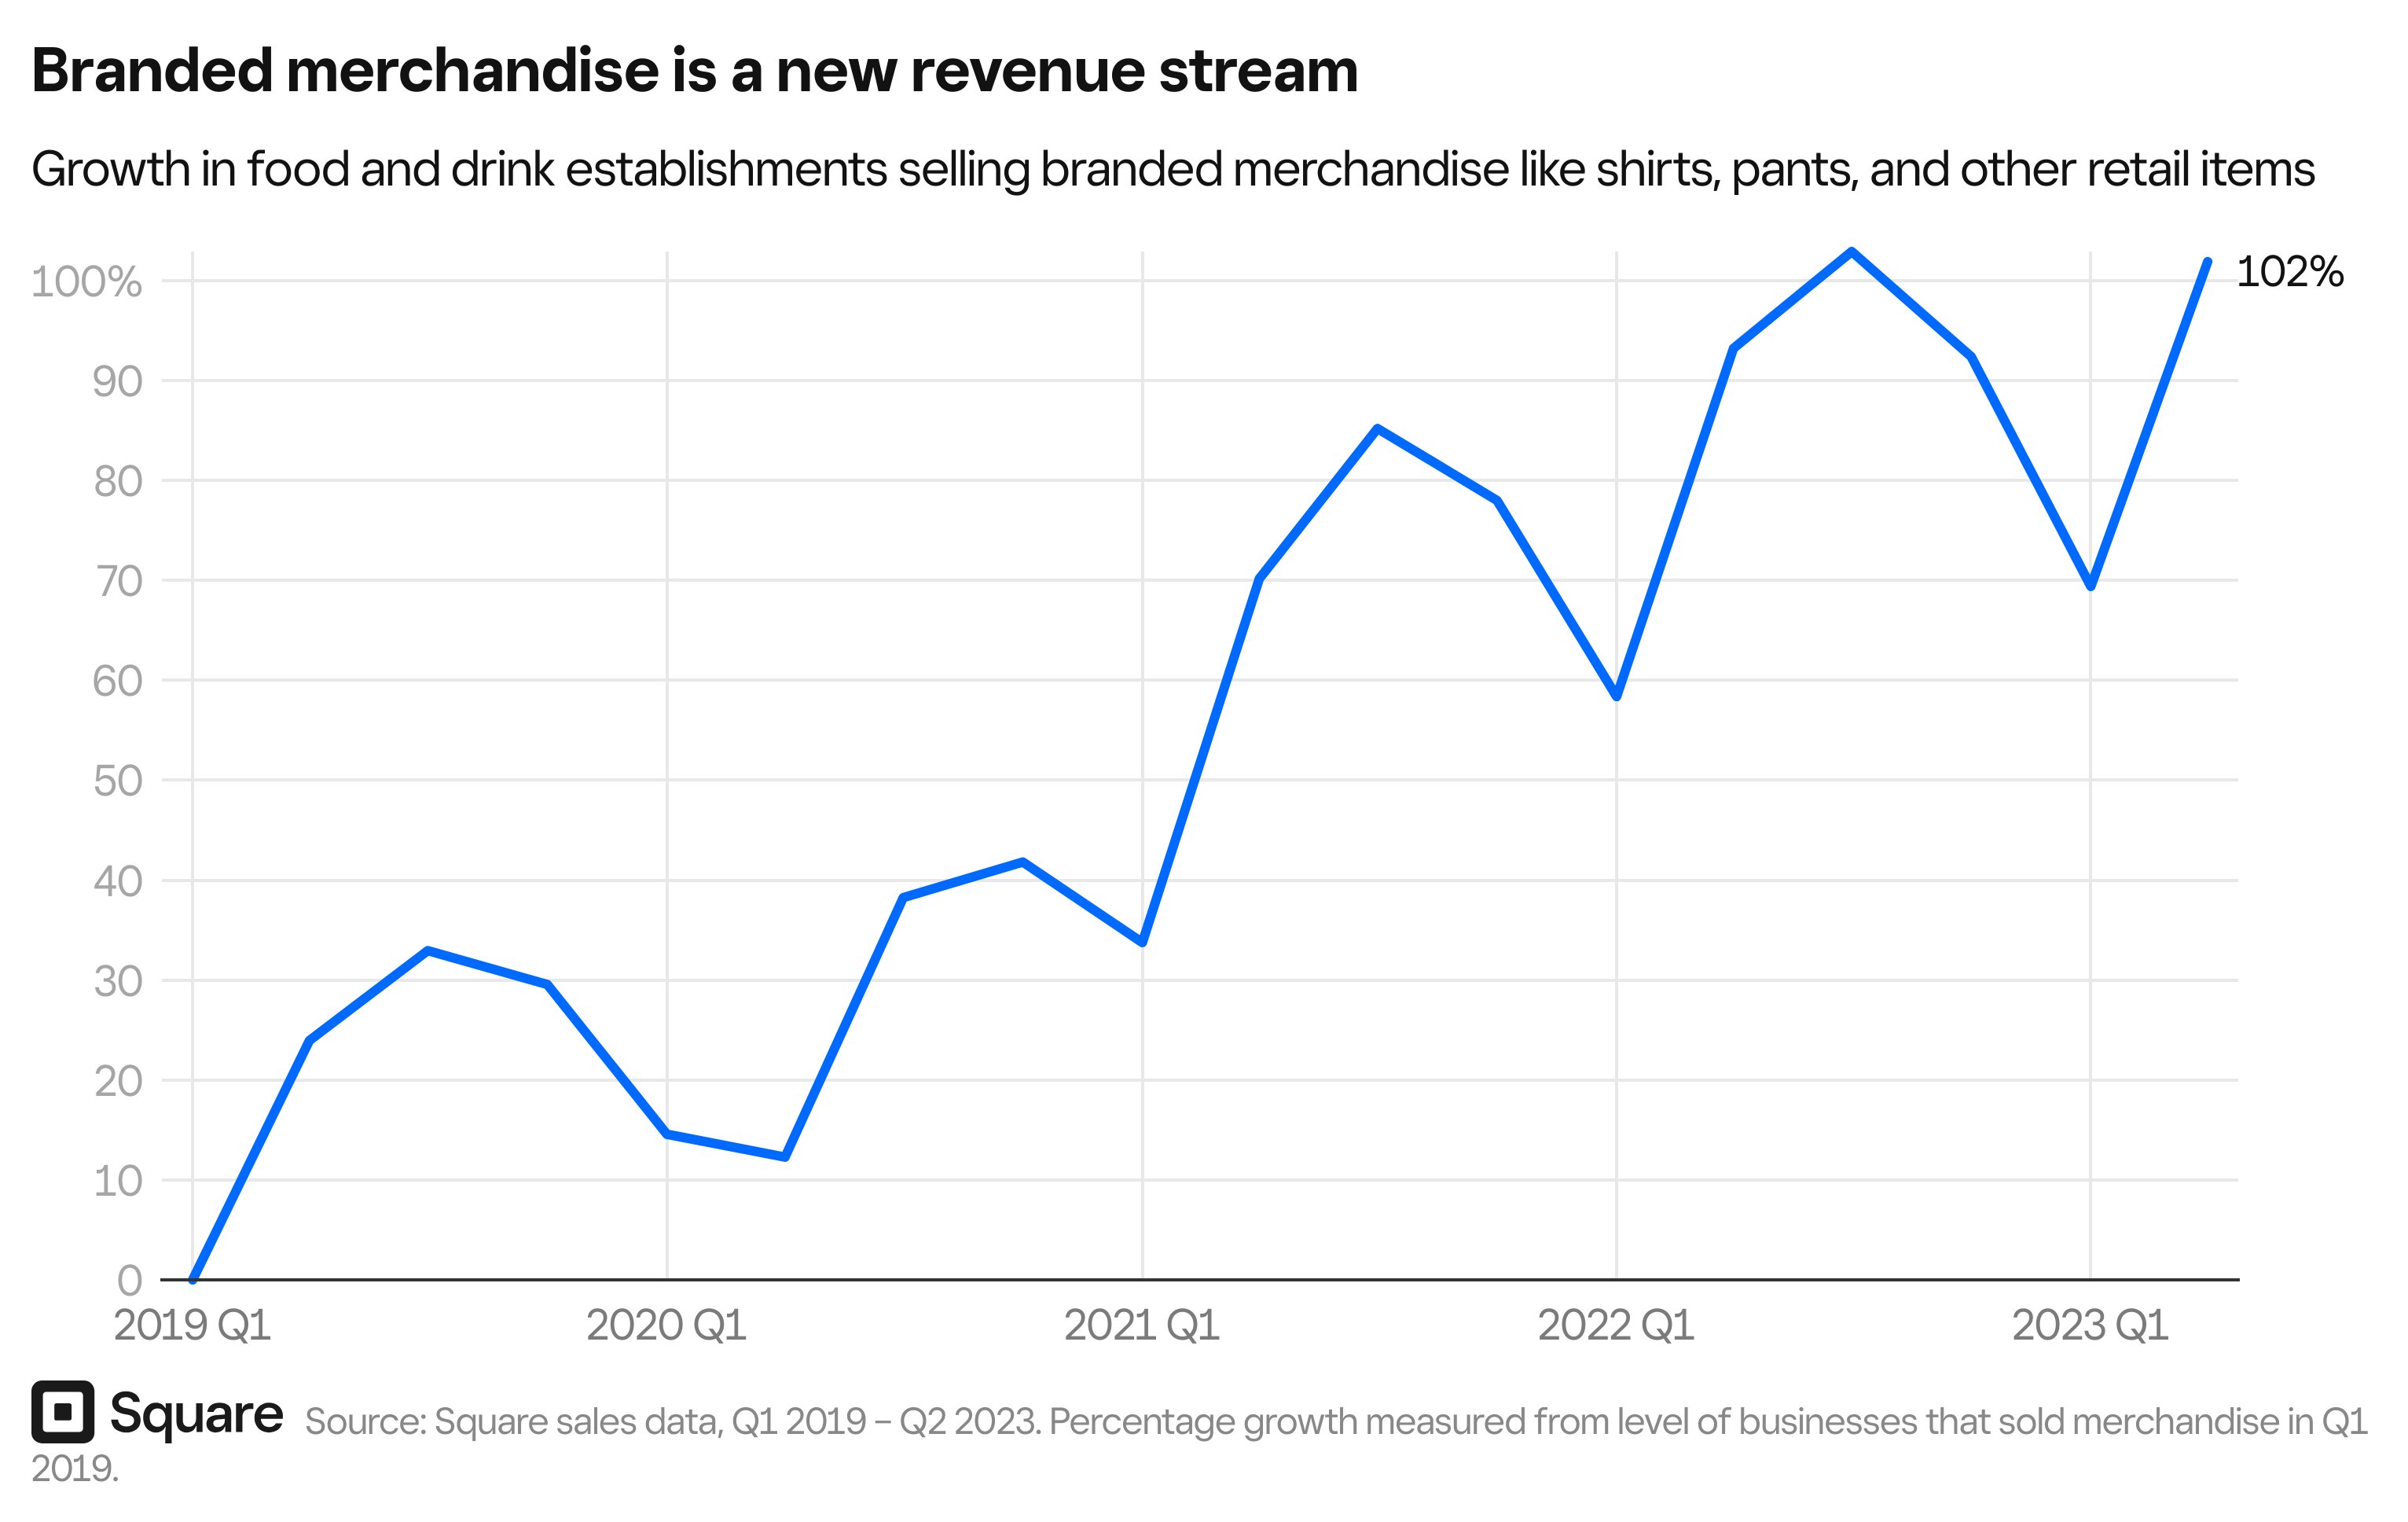
Tonight’s specials are t-shirts with a side of drink koozies: Restaurants lean into branded merchandise
As businesses look to find new and creative ways to increase their revenue and grow their brands, restaurants are expanding their businesses by selling branded merchandise. Since 2019, the number of food and beverage businesses offering branded merch like shirts or hats has doubled.
To expand into new revenue streams like merchandise, restaurants need a flexible POS system that can grow with them – with Square, restaurants can easily use both Square for Restaurants and Square for Retail, giving them the power to run their business all within one ecosystem.