Get Started with the Square Dashboard App
The Dashboard for POS is compatible with iPhones running iOS 12 or above and Android mobile devices running 7 or above. Download the app and generate reports to get a snapshot of your business – daily sales summary, category and item sales — on the go. You can also manage your Square Checking account, your Square Debit Card, and view your Square Savings balance.
Note: The free Square Dashboard app isn’t compatible with iPads and Android devices at this time.
Download the Square Dashboard App
To download the app on iOS:
From your iPhone, visit the iTunes App Store.
Search Square Dashboard.
Tap Get to download the app.
Sign in with your Square account email address and password.
To download the app on Android:
Open the Google Play Store.
Search Square Dashboard.
Tap Install to download the app.
Sign in with your Square account email address and password.
Download the Dashboard Widget for iOS
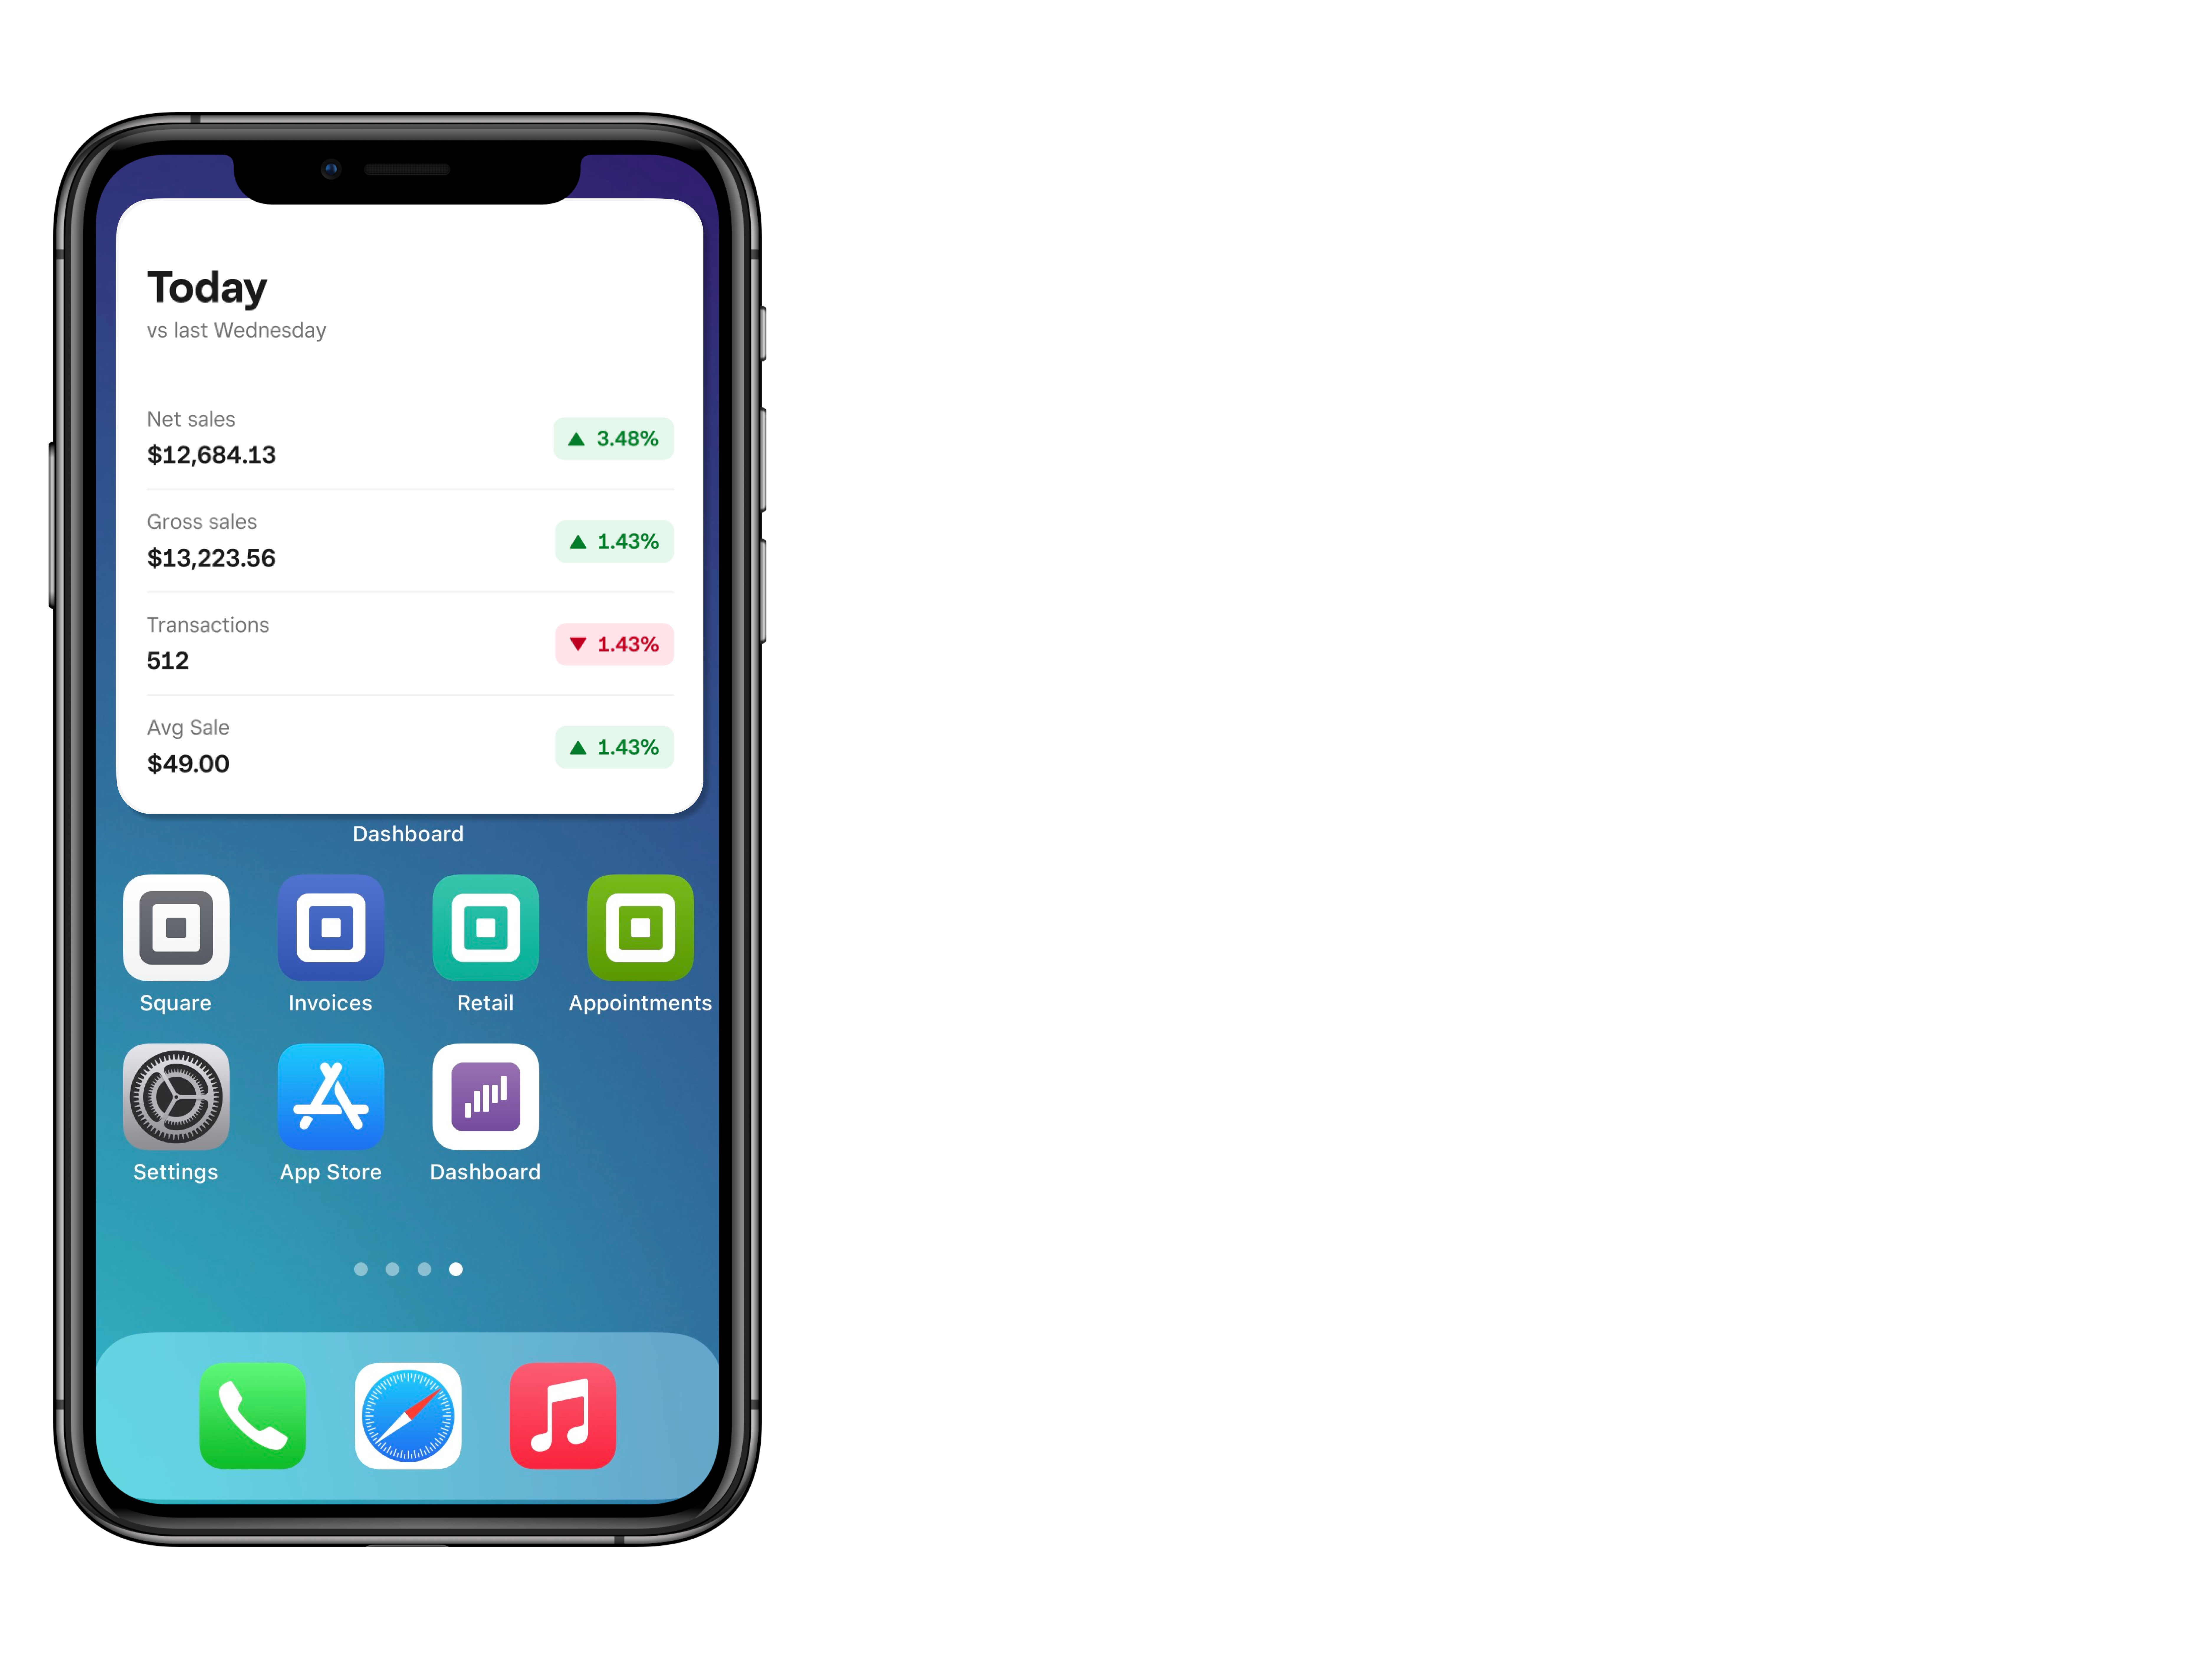
Easily access statistics and data about your business with the Square Dashboard widget. You can view gross sales, net sales, transactions, average sale, returns, discounts, and comps right from your home screen. You can also customize the data timeframe. Note: The Square Dashboard Widget is not yet available for Android devices.
To download the widget:
On your iOS device, tap and hold the home screen.
Tap the plus sign in the top left corner to open the widget menu.
Tap the Widget search bar and type “Dashboard.”
Tap the Dashboard widget icon once, then swipe left or right to select the widget style: Single data point or Key info with multiple data points displayed.
Tap Add Widget.
Drag and drop the widget to the desired location on your screen.
Tap Done.
You can then tap the Dashboard widget and view your business metrics at a glance.
Adjust Widget Settings
You can adjust the Square Dashboard widget settings from the Edit Widget screen and within the widget.
To adjust settings on the widget preview:
Tap and hold the widget.
Tap Edit Widget.
To adjust the time period, tap Time Period and select your preferred time range.
To adjust which metrics you see, tap Metrics. If you have the larger version of the widget that shows multiple metric options, select the name of each metric to adjust the view. To rearrange the order of the metrics in the list, tap and drag the three horizontal lines next to each metric to the desired location.
Square Dashboard App Overview
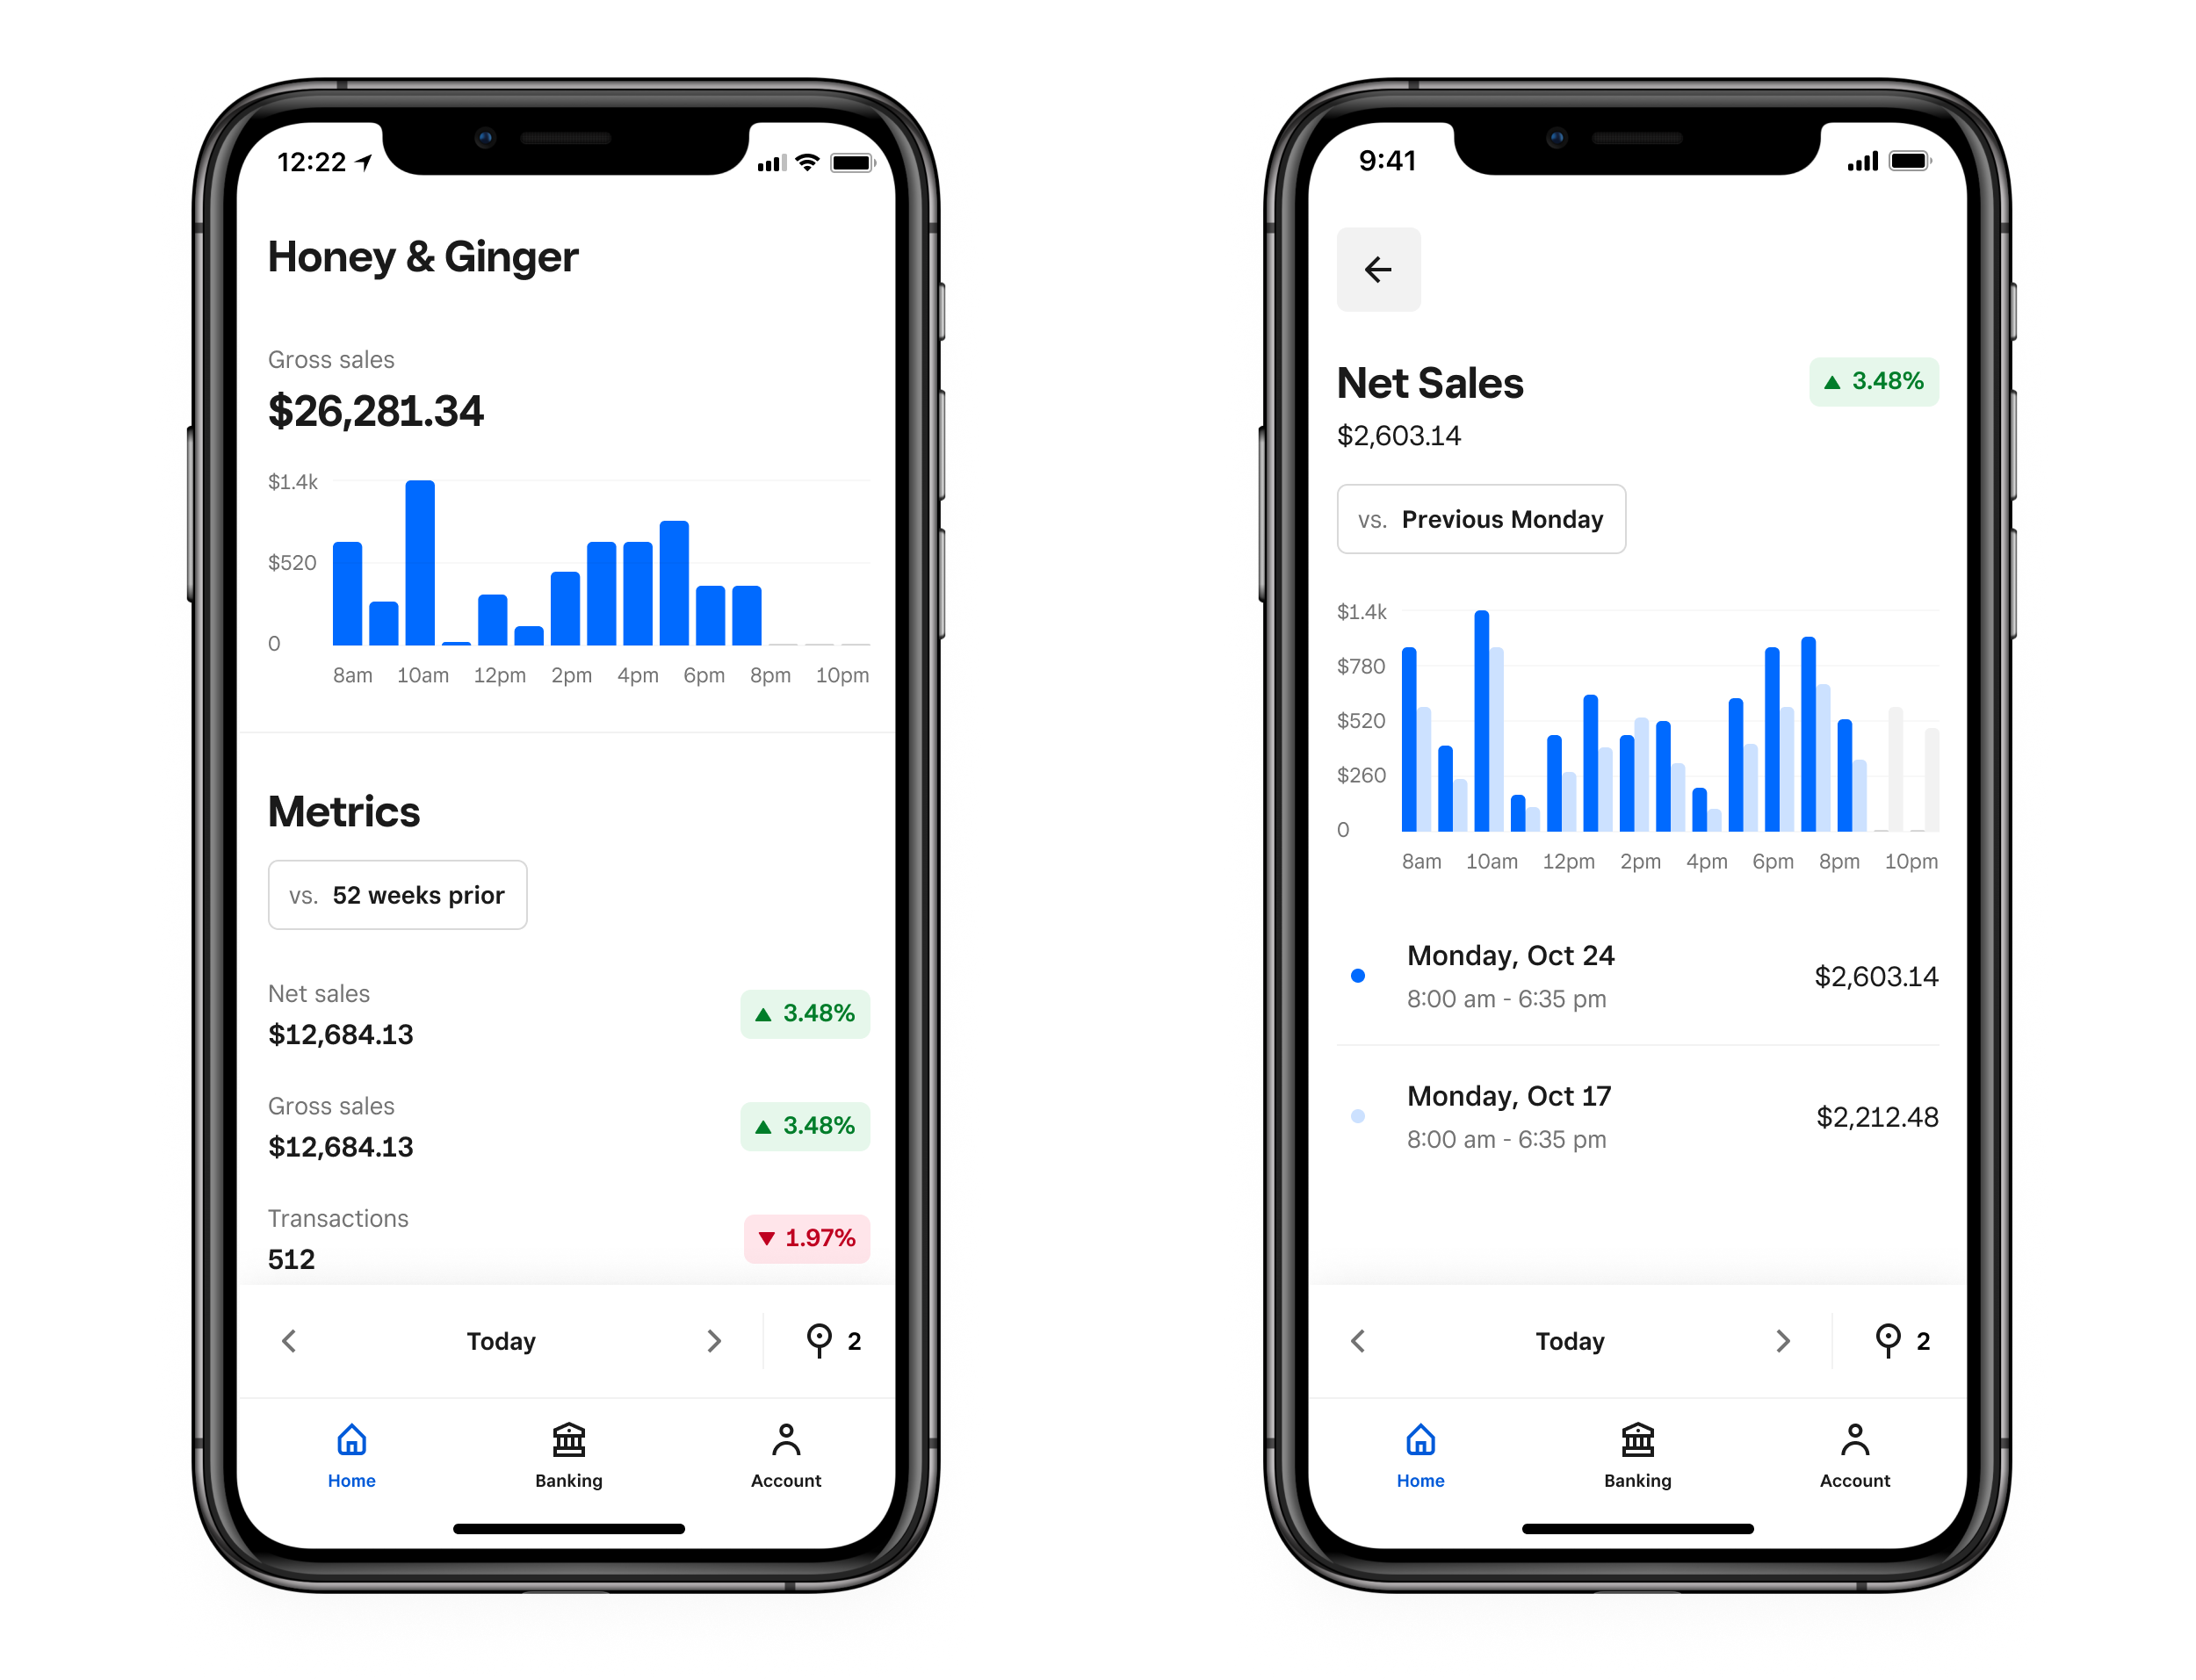
Tap on the specific metrics listed below the chart (Net sales, Gross sales, Transactions, or Average sale) to expand the full report section. From there, you will see a detailed chart for the metric you selected as well as a date selector at the bottom to customize the timeline you wish to view. Tap the back arrow to return to the Dashboard home screen and select another key metric. You can also tap Items or Categories to see a more detailed breakdown of your sales based on the items sold and their categories.
| Data | Description |
|---|---|
| Sales Summary | Review your general sales summary for a specific timeframe – such as hourly, daily, or monthly. You’ll see gross sales, the total number of sales, your average sale amount, and a graph of sales. |
| Sales Comparisons | Compare how your business performed today versus previous days. You can adjust the comparison timeline by day, week, month, year, or a customized timeframe. |
| Categories | View your gross sales by item category for a specific timeframe by tapping Categories on the overview home screen. |
| Items | View an itemized summary of your gross sales for a specific timeframe by tapping Items on the overview home screen. |
| Multi-Locations | You can view sales data for all of your business locations. Make sure you sign in to the app with the email address and password associated with your primary account. Tap the location pin icon in the top-right to view sales data for one specific location or multiple locations at the same time. |
| Notifications | Receive notifications in real time that keep you on top of your business. Tap the notification bell icon on the bottom right of the app to expand and see more details. |
| Square Messages | Send and receive messages from your customers directly from the Dashboard app by tapping the Messages icon in the bottom right toolbar. You can send Square Messages over other Square Point of Sale apps as well as integrate Messages with Facebook Messenger. Learn more about Square Messages. |
To select your reporting location, tap the pin location in the top right-hand corner.
To change the date, tap on the date in the bottom navigation bar and select from today, this week, this month, this year or custom.
FAQ
The Square Dashboard app is compatible with both iPhone and Android mobile devices. iPhones must run iOS 12 or above. Android mobile devices must be 7 or above.
Check to see if your device is compatible, or learn how to update your device software.
Yes, your primary Square account is accessible from the Square Dashboard app. Be sure to sign in with the email address and password associated with your master account.
Tap the location pin icon at the top-right to view a list of all locations associated with your account. Check the box next to the locations you want to see sales data for.
Learn how to manage multiple locations with Square.
The 52 weeks comparison chart will show you data from the same day of the week last year. The 1-year comparison chart will show you sales data from the same date last year. Learn more about summaries and reports from the online Square Dashboard.
If your sales data doesn’t match today compared to last week or year, it’s likely that today’s sales aren’t finished. Sales data and percentages in the app are in real-time. For example, let’s say it’s 4:00 PM right now and you’ve had 100 sales so far. By 4:00 PM a week ago, you had 80 sales, but 120 sales total for the entire day. Currently, the app would show 100 sales today versus 120 for last week, with a +25% week-over-week change. We realize these numbers might be confusing if your sales day hasn’t yet ended — we’re constantly adding new features to the app, so hold tight for improvements.
Invoices are not currently available from the Dashboard app. To send an invoice, log on to your online Square Dashboard or download the free Square Invoices app.