
Trusting your gut as a small business owner is key, but using sales data, reports and analytics to make informed decisions is just as important. Access to the right information makes it easier to plan for the future and grow your business faster and smarter.
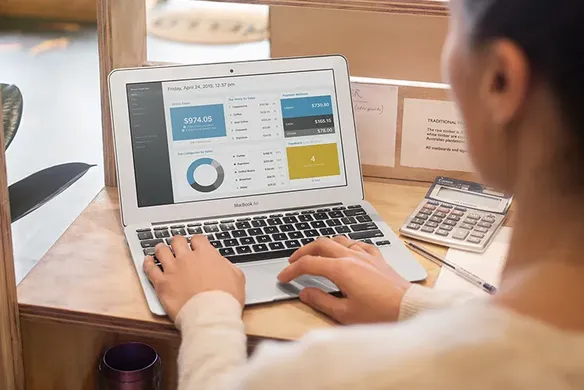
Along with a free point-of-sale app to record what’s happening with your business day-to-day, Square provides a wealth of data like which products are selling best and which days are the busiest. These insights can help you make responsive changes, and grow when and how it makes sense. Best of all, it’s easy to access on your Square Dashboard, or with the new Square Dashboard app.
With all of these options, which pieces of sales data should you be tracking every day?

Sales reports by the hour
Say you’re throwing a special one-day-only promotional event. With the Square Dashboard app you can check in on how it’s going in real time, without even having to be there in person. If your sales are going crazy, it’s a good time to SMS your manager with an encouraging note. If things are a bit slow, you could either cut back on staff hours, or put the word out on social media (Twitter and Instagram are a good start) to remind your followers about the special offer.
Sales reports by category
You don’t need to log in to Square Dashboard to see which category of products are selling best; just use the Square Dashboard app. For example, you might see that the Doughboys Doughnuts in your cafe are selling out early in the day. You can use this data to make on-the-spot decisions like promoting another category of pastries, or checking with your supplier to see if you can get a last-minute delivery to meet demand.
Sales reports by item
Both Square Dashboard and the Dashboard app give you real-time information about what items are selling well. This information can immediately help you make smarter inventory and purchasing decisions. When you notice that a particular beverage isn’t selling anymore — perhaps mulled wine is less popular now that winter is on the way out — you can review the menu and plan to replace this item with something a bit more seasonally appropriate!
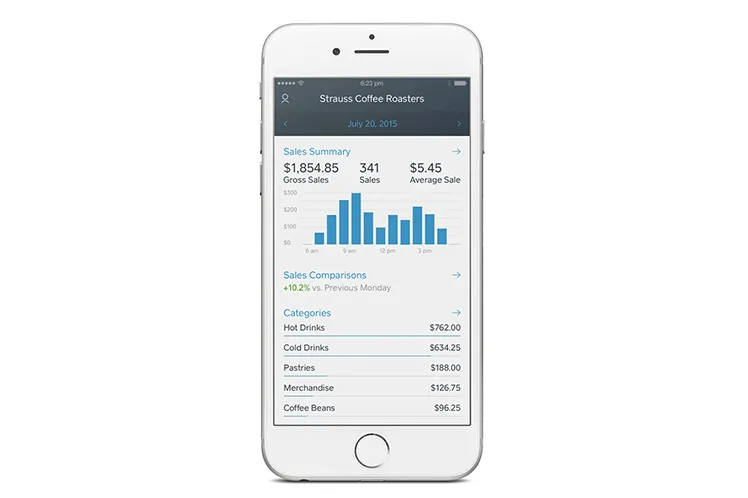
Sales summaries
Don’t have time for a deep data dive? Two key metrics are readily available on the Dashboard app home screen that gives you a quick snapshot of your business performance: your Average Sale and Sales Comparisons charts. The Sales Comparison chart allows you to see today’s sales versus sales from the previous day or week. If your average sale value is down for the day, you can let your staff know it’s time to try suggesting an add-on item at checkout. These charts provide the right data to help you keep sales numbers up and ensure that your business is growing.
How do you use your data to make smarter business decisions? Tell us on Twitter! Learn more about Square Dashboard and Analytics.
![]()


